from IPython.display import HTML
from itables import to_html_datatable
import numpy as np
import pandas as pd
import scipy.stats as st
import simpy
from sim_tools.distributions import ExponentialReplications
Learning objectives:
- Adapt our model to run multiple replications.
Pre-reading:
This page continues on from: Performance measures.
Entity generation → Entity processing → Initialisation bias → Performance measures → Replications
Required packages:
These should be available from environment setup in the “Test yourself” section of Environments.
library(dplyr)
library(kableExtra)
library(knitr)
library(simmer)
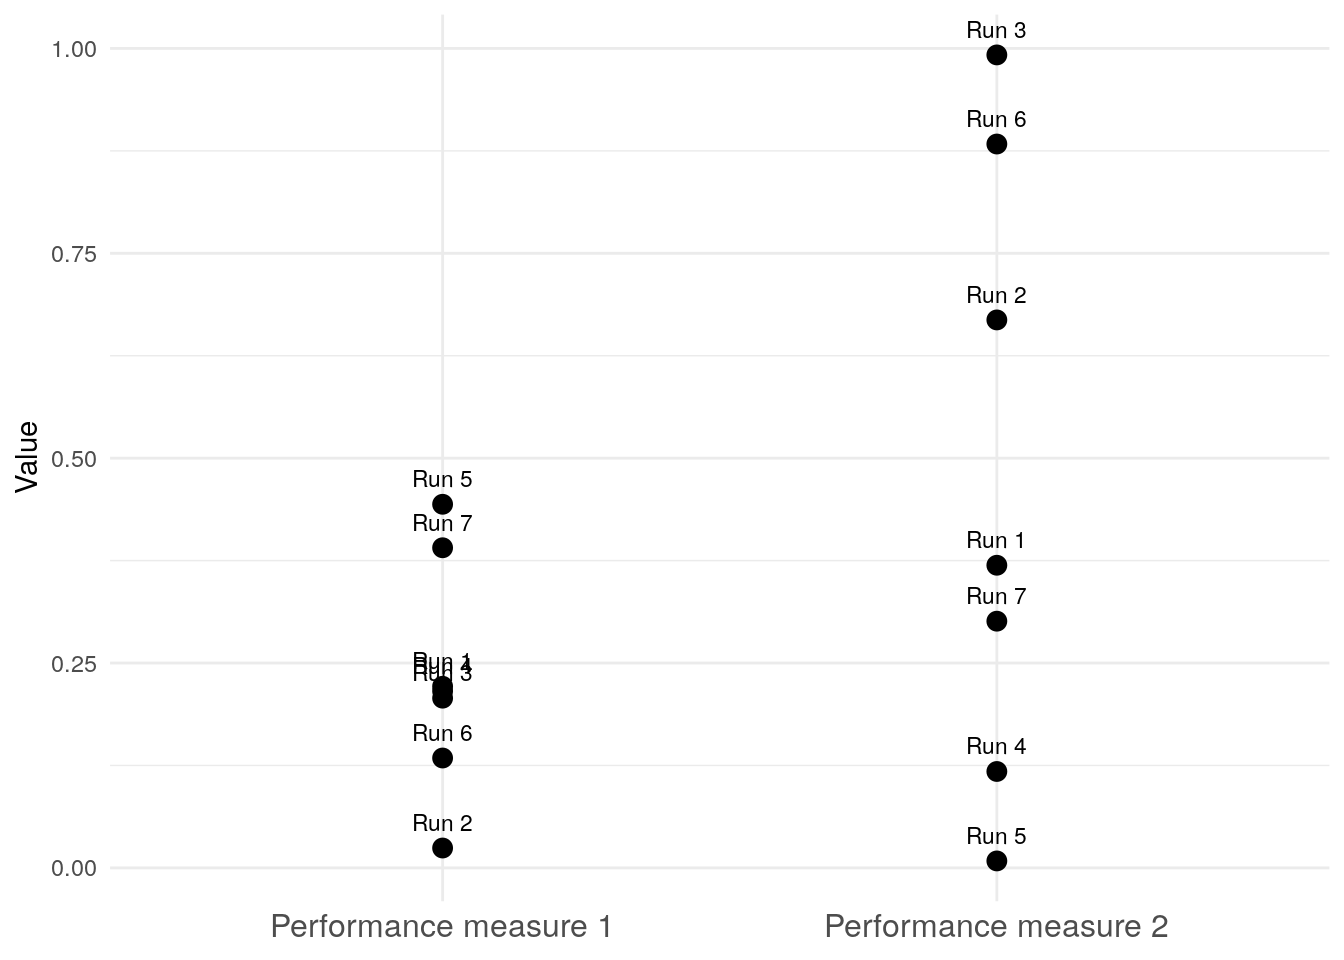
library(tidyr)Replications in discrete event simulation are necessary because each run includes randomness, leading to different results every time.
Running multiple replications reveals the range and variability of possible system outcomes, allowing the calculation of averages and confidence intervals for results.
How to run replications
We will continue working with the model developed on the previous pages. This model contains all the metrics from the Performance measures page (with utilisation implemented via the time-weighted approach).
Note: The results will look different to the previous page for several of the metrics. This is due to mean time in consultation. As mentioned on the Performance measures page, mean time in consultation requires saving sampled times using
set_attribute()ahead of resource use. This changes the order in which random numbers are drawn from the simulation’s global random number generator. As a result, even with the same seed and parameters, the results will differ from previous runs before we added the metric.
Parameter class
Let’s add a new attribute number_of_runs. We’ve arbitrarily set this to five, but the Number of replications page shows how to choose a suitable number to run.
class Parameters:
    """
    Parameter class.

    Attributes
    ----------
    interarrival_time : float
        Mean time between arrivals (minutes).
    consultation_time : float
        Mean length of doctor's consultation (minutes).
    number_of_doctors : int
        Number of doctors.
    warm_up_period : int
        Duration of the warm-up period (minutes).
    data_collection_period : int
        Duration of the data collection period (minutes).
    number_of_runs : int
        The number of runs (i.e., replications).
    verbose : bool
        Whether to print messages as simulation runs.
    """
    def __init__(
        self, interarrival_time=5, consultation_time=10,
        number_of_doctors=3, warm_up_period=30, data_collection_period=40,
        number_of_runs=5, verbose=False
    ):
        """
        Initialise Parameters instance.

        Parameters
        ----------
        interarrival_time : float
            Time between arrivals (minutes).
        consultation_time : float
            Length of consultation (minutes).
        number_of_doctors : int
            Number of doctors.
        warm_up_period : int
            Duration of the warm-up period (minutes).
        data_collection_period : int
            Duration of the data collection period (minutes).
        number_of_runs : int
            The number of runs (i.e., replications).
        verbose : bool
            Whether to print messages as simulation runs.
        """
        self.interarrival_time = interarrival_time
        self.consultation_time = consultation_time
        self.number_of_doctors = number_of_doctors
        self.warm_up_period = warm_up_period
        self.data_collection_period = data_collection_period
        self.number_of_runs = number_of_runs
        self.verbose = verbose
Patient class
No changes required.
Monitored resource class
No changes required.
Model class
No changes required.
Summary statistics function
This function computes descriptive statistics for a dataset, returning the mean, standard deviation, and 95% confidence interval.
If the input has no valid values, all outputs are
NaN.If the input has fewer than 3 values, it returns the mean only, with the rest as
NaN.If the input has 3 or more values, it calculates the mean, standard deviation, and a 95% confidence interval using the t-distribution (
scipy.stats).If all values are identical (zero variance), the confidence interval equals the mean.
def summary_stats(data):
    """
    Calculate mean, standard deviation and 95% confidence interval (CI).

    Parameters
    ----------
    data : pd.Series
        Data to use in calculation.

    Returns
    -------
    tuple
        (mean, standard deviation, CI lower, CI upper).
    """
    # Remove any NaN from the series
    data = data.dropna()

    # Find number of observations
    count = len(data)

    # If there are no observations, then set all to NaN
    if count == 0:
        mean, std_dev, ci_lower, ci_upper = np.nan, np.nan, np.nan, np.nan
    # If there is only one or two observations, can do mean but not others
    elif count < 3:
        mean = data.mean()
        std_dev, ci_lower, ci_upper = np.nan, np.nan, np.nan
    # With more than one observation, can calculate all...
    else:
        mean = data.mean()
        std_dev = data.std()
        # Special case for CI if variance is 0
        if np.var(data) == 0:
            ci_lower, ci_upper = mean, mean
        else:
            # Calculation of CI uses t-distribution, which is suitable for
            # smaller sample sizes (n<30)
            ci_lower, ci_upper = st.t.interval(
                confidence=0.95,
                df=count-1,
                loc=mean,
                scale=st.sem(data))
    return mean, std_dev, ci_lower, ci_upper
Runner class
We run replications with a new method run_reps(), explained line-by-line below.
class Runner:
    """
    Run the simulation.

    Attributes
    ----------
    param : Parameters
        Simulation parameters.
    """
    def __init__(self, param):
        """
        Initialise a new instance of the Runner class.

        Parameters
        ----------
        param : Parameters
            Simulation parameters.
        """
        self.param = param

    def run_single(self, run):
        """
        Runs the simulation once and performs results calculations.

        Parameters
        ----------
        run : int
            Run number for the simulation.

        Returns
        -------
        dict
            Contains patient-level results and results from each run.
        """
        model = Model(param=self.param, run_number=run)
        model.run()

        # Patient results
        patient_results = pd.DataFrame(model.results_list)
        patient_results["run"] = run
        patient_results["time_in_system"] = (
            patient_results["end_time"] - patient_results["arrival_time"]
        )
        # For each patient, if they haven't seen a doctor yet, calculate
        # their wait as current time minus arrival, else set as missing
        patient_results["unseen_wait_time"] = np.where(
            patient_results["time_with_doctor"].isna(),
            model.env.now - patient_results["arrival_time"], np.nan
        )

        # Run results
        run_results = {
            "run_number": run,
            "arrivals": len(patient_results),
            "mean_wait_time": patient_results["wait_time"].mean(),
            "mean_time_with_doctor": (
                patient_results["time_with_doctor"].mean()
            ),
            "mean_utilisation_tw": (
                sum(model.doctor.area_resource_busy) / (
                    self.param.number_of_doctors *
                    self.param.data_collection_period
                )
            ),
            "mean_queue_length": (
                sum(model.doctor.area_n_in_queue) /
                self.param.data_collection_period
            ),
            "mean_time_in_system": patient_results["time_in_system"].mean(),
            "mean_patients_in_system": (
                sum(model.area_n_in_system) /
                self.param.data_collection_period
            ),
            "unseen_count": patient_results["time_with_doctor"].isna().sum(),
            "unseen_wait_time": patient_results["unseen_wait_time"].mean()
        }

        return {
            "patient": patient_results,
            "run": run_results
        }

    def run_reps(self):
        """
        Execute a single model configuration for multiple runs.

        Returns
        -------
        dict
            Contains patient-level results, results from each run and
            overall results.
        """
        # Run replications
        all_results = [self.run_single(run)
                       for run in range(self.param.number_of_runs)]

        # Separate results from each run into appropriate lists
        patient_results_list = [result["patient"] for result in all_results]
        run_results_list = [result["run"] for result in all_results]

        # Convert lists into dataframes
        patient_results_df = pd.concat(
            patient_results_list, ignore_index=True
        )
        run_results_df = pd.DataFrame(run_results_list)

        # Calculate average results and uncertainty from across all runs
        uncertainty_metrics = {}
        run_col = run_results_df.columns

        # Loop through the run performance measure columns
        # Calculate mean, standard deviation and 95% confidence interval
        for col in run_col[~run_col.isin(["run_number", "scenario"])]:
            uncertainty_metrics[col] = dict(zip(
                ["mean", "std_dev", "lower_95_ci", "upper_95_ci"],
                summary_stats(run_results_df[col])
            ))
        # Convert to dataframe
        overall_results_df = pd.DataFrame(uncertainty_metrics)

        return {
            "patient": patient_results_df,
            "run": run_results_df,
            "overall": overall_results_df
        }
Explaining Runner.run_reps()
def run_reps(self):
    """
    Execute a single model configuration for multiple runs.

    Returns
    -------
    dict
        Contains patient-level results, results from each run and
        overall results.
    """
    # Run replications
    all_results = [self.run_single(run)
                    for run in range(self.param.number_of_runs)]
It starts by calling run_single() repeatedly for the requested number of simulation runs, passing the run number to set the random seed (ensuring each run uses a different seed!).
# Separate results from each run into appropriate lists
patient_results_list = [result["patient"] for result in all_results]
run_results_list = [result["run"] for result in all_results]

# Convert lists into dataframes
patient_results_df = pd.concat(
    patient_results_list, ignore_index=True
)
run_results_df = pd.DataFrame(run_results_list)
The results then get stacked on top of each other, so you end up with one big dataframe for all patients, and another for all runs. The replication column shows which run each row came from.
# Calculate average results and uncertainty from across all runs
uncertainty_metrics = {}
run_col = run_results_df.columns

# Loop through the run performance measure columns
# Calculate mean, standard deviation and 95% confidence interval
for col in run_col[~run_col.isin(["run_number", "scenario"])]:
    uncertainty_metrics[col] = dict(zip(
        ["mean", "std_dev", "lower_95_ci", "upper_95_ci"],
        summary_stats(run_results_df[col])
    ))
# Convert to dataframe
overall_results_df = pd.DataFrame(uncertainty_metrics)
We then calculate summary statistics (mean, standard deviation, and 95% confidence interval) for each run in run_results_df using summary_stats().
return {
    "patient": patient_results_df,
    "run": run_results_df,
    "overall": overall_results_df
}
At the end, the function returns a dictionary with all patient results (patient), all run results (run), and a summary table with statistics calculated across all runs (overall).
Run the model
runner = Runner(param=Parameters())
result = runner.run_reps()
HTML(to_html_datatable(result["patient"]))| Loading ITables v2.5.2 from the internet... (need help?) |
HTML(to_html_datatable(result["run"]))| Loading ITables v2.5.2 from the internet... (need help?) |
HTML(to_html_datatable(result["overall"]))| Loading ITables v2.5.2 from the internet... (need help?) |
Parameter function
Let’s add a new attribute number_of_runs. We’ve arbitrarily set this to five, but the Number of replications page shows how to choose a suitable number to run.
#' Generate parameter list.
#'
#' @param interarrival_time Numeric. Time between arrivals (minutes).
#' @param consultation_time Numeric. Mean length of doctor's
#'   consultation (minutes).
#' @param number_of_doctors Numeric. Number of doctors.
#' @param warm_up_period Numeric. Duration of the warm-up period (minutes).
#' @param data_collection_period Numeric. Duration of the data collection
#'   period (minutes).
#' @param number_of_runs Numeric. The number of runs (i.e., replications).
#' @param verbose Boolean. Whether to print messages as simulation runs.
#'
#' @return A named list of parameters.
#' @export

create_params <- function(
  interarrival_time = 5L,
  consultation_time = 10L,
  number_of_doctors = 3L,
  warm_up_period = 30L,
  data_collection_period = 40L,
  number_of_runs = 5L,
  verbose = FALSE
) {
  list(
    interarrival_time = interarrival_time,
    consultation_time = consultation_time,
    number_of_doctors = number_of_doctors,
    warm_up_period = warm_up_period,
    data_collection_period = data_collection_period,
    number_of_runs = number_of_runs,
    verbose = verbose
  )
}
Warm-up function
No changes required.
Functions to calculate different metrics
No changes required.
Run results function
No changes required.
Model function
No changes required.
Runner function
This new function runner() runs the simulation model multiple times based on the specified param[["number_of_runs"]]. It passes the run number to set the random seed (ensuring each run uses a different seed!).
It combines the results into unified output tables for arrivals, resources and run-level results. If only one replication is requested, it simply returns that single result without combining.
#' Run simulation for multiple replications.
#'
#' @param param Named list of model parameters.
#'
#' @return List with three tables: arrivals, resources and run_results.
#' @export

runner <- function(param) {
  # Run simulation for multiple replications
  results <- lapply(
    seq_len(param[["number_of_runs"]]),
    function(i) {
      model(run_number = i, param = param)
    }
  )

  # If only one replication, return without changes
  if (param[["number_of_runs"]] == 1L) {
    return(results[[1L]])
  }

  # Combine results from all replications into unified tables
  all_arrivals <- do.call(
    rbind, lapply(results, function(x) x[["arrivals"]])
  )
  all_resources <- do.call(
    rbind, lapply(results, function(x) x[["resources"]])
  )

  # run_results may have missing data - use bind_rows to fill NAs automatically
  all_run_results <- dplyr::bind_rows(
    lapply(results, function(x) x[["run_results"]])
  )

  all_patients_in_system <- dplyr::bind_rows(
    lapply(results, function(x) x[["patients_in_system"]])
  )

  # Return a list containing the combined tables
  list(
    arrivals = all_arrivals,
    resources = all_resources,
    run_results = all_run_results,
    patients_in_system = all_patients_in_system
  )
}
Run the model
param <- create_params()
result <- runner(param = param)
result[["arrivals"]] |>
  arrange(replication, start_time) |>
  kable() |>
scroll_box(height = "400px")| name | start_time | end_time | activity_time | resource | replication | queue_on_arrival | serve_start | serve_length | time_in_system | wait_time |
|---|---|---|---|---|---|---|---|---|---|---|
| patient6 | 30.75713 | NA | NA | doctor | 1 | 0 | 30.75713 | 44.2393422 | NA | 0.0000000 |
| patient7 | 36.02984 | 46.38228 | 10.3524395 | doctor | 1 | 0 | 36.02984 | 10.3524395 | 10.3524395 | 0.0000000 |
| patient8 | 45.41002 | 51.95749 | 6.5474664 | doctor | 1 | 0 | 45.41002 | 6.5474664 | 6.5474664 | 0.0000000 |
| patient9 | 47.09469 | 52.97948 | 5.8847972 | doctor | 1 | 0 | 47.09469 | 5.8847972 | 5.8847972 | 0.0000000 |
| patient10 | 58.91726 | 65.33619 | 6.4189259 | doctor | 1 | 0 | 58.91726 | 6.4189259 | 6.4189259 | 0.0000000 |
| patient11 | 60.38786 | 66.04652 | 5.6586552 | doctor | 1 | 0 | 60.38786 | 5.6586552 | 5.6586552 | 0.0000000 |
| patient12 | 60.91823 | NA | NA | doctor | 1 | 0 | 65.33619 | 11.7331211 | NA | 4.4179608 |
| patient13 | 61.21542 | NA | NA | doctor | 1 | 1 | 66.04652 | 9.9681296 | NA | 4.8310963 |
| patient14 | 64.10899 | NA | NA | doctor | 1 | 2 | NA | NA | NA | NA |
| patient7 | 34.95654 | 42.92251 | 7.9659722 | doctor | 2 | 0 | 34.95654 | 7.9659722 | 7.9659722 | 0.0000000 |
| patient8 | 42.18289 | NA | NA | doctor | 2 | 0 | 42.18289 | 44.9194233 | NA | 0.0000000 |
| patient9 | 50.70005 | 56.90389 | 6.2038429 | doctor | 2 | 0 | 50.70005 | 6.2038429 | 6.2038429 | 0.0000000 |
| patient10 | 52.48242 | 59.37100 | 6.8885801 | doctor | 2 | 0 | 52.48242 | 6.8885801 | 6.8885801 | 0.0000000 |
| patient11 | 56.64556 | NA | NA | doctor | 2 | 0 | 56.90389 | 15.9005238 | NA | 0.2583307 |
| patient12 | 58.31782 | NA | NA | doctor | 2 | 0 | 59.37100 | 10.8950082 | NA | 1.0531762 |
| patient13 | 58.71667 | NA | NA | doctor | 2 | 1 | NA | NA | NA | NA |
| patient14 | 61.47146 | NA | NA | doctor | 2 | 1 | NA | NA | NA | NA |
| patient15 | 61.49116 | NA | NA | doctor | 2 | 2 | NA | NA | NA | NA |
| patient16 | 64.59513 | NA | NA | doctor | 2 | 3 | NA | NA | NA | NA |
| patient7 | 31.68591 | 33.68054 | 1.9946313 | doctor | 3 | 0 | 31.68591 | 1.9946313 | 1.9946313 | 0.0000000 |
| patient8 | 33.62819 | 45.72654 | 12.0983475 | doctor | 3 | 0 | 33.62819 | 12.0983475 | 12.0983475 | 0.0000000 |
| patient9 | 39.55955 | 57.04574 | 17.4861950 | doctor | 3 | 0 | 39.55955 | 17.4861950 | 17.4861950 | 0.0000000 |
| patient10 | 43.92088 | 53.91676 | 8.1902235 | doctor | 3 | 0 | 45.72654 | 8.1902235 | 9.9958851 | 1.8056616 |
| patient11 | 44.62077 | 59.64239 | 5.7256241 | doctor | 3 | 1 | 53.91676 | 5.7256241 | 15.0216166 | 9.2959925 |
| patient12 | 54.85752 | 58.46069 | 1.4149504 | doctor | 3 | 0 | 57.04574 | 1.4149504 | 3.6031694 | 2.1882191 |
| patient13 | 63.70977 | NA | NA | doctor | 3 | 0 | 63.70977 | 13.7027903 | NA | 0.0000000 |
| patient14 | 67.52795 | NA | NA | doctor | 3 | 0 | 67.52795 | 33.0249086 | NA | 0.0000000 |
| patient10 | 38.64686 | 42.86897 | 1.6786021 | doctor | 4 | 1 | 41.19037 | 1.6786021 | 4.2221176 | 2.5435155 |
| patient11 | 39.86742 | 61.20384 | 18.3348719 | doctor | 4 | 1 | 42.86897 | 18.3348719 | 21.3364246 | 3.0015528 |
| patient12 | 67.56626 | 68.15052 | 0.5842628 | doctor | 4 | 0 | 67.56626 | 0.5842628 | 0.5842628 | 0.0000000 |
| patient13 | 69.52374 | NA | NA | doctor | 4 | 0 | 69.52374 | 12.4758717 | NA | 0.0000000 |
| patient9 | 35.27459 | 41.59611 | 6.3215214 | doctor | 5 | 0 | 35.27459 | 6.3215214 | 6.3215214 | 0.0000000 |
| patient10 | 44.05495 | 47.86583 | 3.8108866 | doctor | 5 | 0 | 44.05495 | 3.8108866 | 3.8108866 | 0.0000000 |
| patient11 | 54.93294 | 60.80512 | 5.8721868 | doctor | 5 | 0 | 54.93294 | 5.8721868 | 5.8721868 | 0.0000000 |
| patient12 | 56.26097 | 68.57552 | 12.3145493 | doctor | 5 | 0 | 56.26097 | 12.3145493 | 12.3145493 | 0.0000000 |
| patient13 | 56.92370 | 67.95916 | 7.1540346 | doctor | 5 | 0 | 60.80512 | 7.1540346 | 11.0354604 | 3.8814258 |
| patient14 | 60.15735 | 69.76202 | 7.2308198 | doctor | 5 | 1 | 62.53120 | 7.2308198 | 9.6046736 | 2.3738538 |
| patient15 | 66.24633 | NA | NA | doctor | 5 | 0 | 67.95916 | 14.7750160 | NA | 1.7128224 |
kable(result[["resources"]]) |> scroll_box(height = "400px")| resource | time | server | queue | capacity | queue_size | system | limit | replication |
|---|---|---|---|---|---|---|---|---|
| doctor | 30.00000 | 2 | 0 | 3 | Inf | 2 | Inf | 1 |
| doctor | 30.75713 | 3 | 0 | 3 | Inf | 3 | Inf | 1 |
| doctor | 32.18941 | 2 | 0 | 3 | Inf | 2 | Inf | 1 |
| doctor | 35.63447 | 1 | 0 | 3 | Inf | 1 | Inf | 1 |
| doctor | 36.02984 | 2 | 0 | 3 | Inf | 2 | Inf | 1 |
| doctor | 45.41002 | 3 | 0 | 3 | Inf | 3 | Inf | 1 |
| doctor | 46.38228 | 2 | 0 | 3 | Inf | 2 | Inf | 1 |
| doctor | 47.09469 | 3 | 0 | 3 | Inf | 3 | Inf | 1 |
| doctor | 51.95749 | 2 | 0 | 3 | Inf | 2 | Inf | 1 |
| doctor | 52.97948 | 1 | 0 | 3 | Inf | 1 | Inf | 1 |
| doctor | 58.91726 | 2 | 0 | 3 | Inf | 2 | Inf | 1 |
| doctor | 60.38786 | 3 | 0 | 3 | Inf | 3 | Inf | 1 |
| doctor | 60.91823 | 3 | 1 | 3 | Inf | 4 | Inf | 1 |
| doctor | 61.21542 | 3 | 2 | 3 | Inf | 5 | Inf | 1 |
| doctor | 64.10899 | 3 | 3 | 3 | Inf | 6 | Inf | 1 |
| doctor | 65.33619 | 3 | 2 | 3 | Inf | 5 | Inf | 1 |
| doctor | 66.04652 | 3 | 1 | 3 | Inf | 4 | Inf | 1 |
| doctor | 30.00000 | 3 | 0 | 3 | Inf | 3 | Inf | 2 |
| doctor | 30.99578 | 2 | 0 | 3 | Inf | 2 | Inf | 2 |
| doctor | 34.95654 | 3 | 0 | 3 | Inf | 3 | Inf | 2 |
| doctor | 38.60992 | 2 | 0 | 3 | Inf | 2 | Inf | 2 |
| doctor | 42.18289 | 3 | 0 | 3 | Inf | 3 | Inf | 2 |
| doctor | 42.92251 | 2 | 0 | 3 | Inf | 2 | Inf | 2 |
| doctor | 45.44842 | 1 | 0 | 3 | Inf | 1 | Inf | 2 |
| doctor | 50.70005 | 2 | 0 | 3 | Inf | 2 | Inf | 2 |
| doctor | 52.48242 | 3 | 0 | 3 | Inf | 3 | Inf | 2 |
| doctor | 56.64556 | 3 | 1 | 3 | Inf | 4 | Inf | 2 |
| doctor | 56.90389 | 3 | 0 | 3 | Inf | 3 | Inf | 2 |
| doctor | 58.31782 | 3 | 1 | 3 | Inf | 4 | Inf | 2 |
| doctor | 58.71667 | 3 | 2 | 3 | Inf | 5 | Inf | 2 |
| doctor | 59.37100 | 3 | 1 | 3 | Inf | 4 | Inf | 2 |
| doctor | 61.47146 | 3 | 2 | 3 | Inf | 5 | Inf | 2 |
| doctor | 61.49116 | 3 | 3 | 3 | Inf | 6 | Inf | 2 |
| doctor | 64.59513 | 3 | 4 | 3 | Inf | 7 | Inf | 2 |
| doctor | 30.00000 | 2 | 0 | 3 | Inf | 2 | Inf | 3 |
| doctor | 31.68591 | 3 | 0 | 3 | Inf | 3 | Inf | 3 |
| doctor | 32.05731 | 2 | 0 | 3 | Inf | 2 | Inf | 3 |
| doctor | 33.62819 | 3 | 0 | 3 | Inf | 3 | Inf | 3 |
| doctor | 33.68054 | 2 | 0 | 3 | Inf | 2 | Inf | 3 |
| doctor | 39.55955 | 3 | 0 | 3 | Inf | 3 | Inf | 3 |
| doctor | 43.92088 | 3 | 1 | 3 | Inf | 4 | Inf | 3 |
| doctor | 44.62077 | 3 | 2 | 3 | Inf | 5 | Inf | 3 |
| doctor | 45.72654 | 3 | 1 | 3 | Inf | 4 | Inf | 3 |
| doctor | 53.91676 | 3 | 0 | 3 | Inf | 3 | Inf | 3 |
| doctor | 54.85752 | 3 | 1 | 3 | Inf | 4 | Inf | 3 |
| doctor | 57.04574 | 3 | 0 | 3 | Inf | 3 | Inf | 3 |
| doctor | 58.46069 | 2 | 0 | 3 | Inf | 2 | Inf | 3 |
| doctor | 59.64239 | 1 | 0 | 3 | Inf | 1 | Inf | 3 |
| doctor | 63.70977 | 2 | 0 | 3 | Inf | 2 | Inf | 3 |
| doctor | 67.52795 | 3 | 0 | 3 | Inf | 3 | Inf | 3 |
| doctor | 30.00000 | 3 | 2 | 3 | Inf | 5 | Inf | 4 |
| doctor | 31.07024 | 3 | 1 | 3 | Inf | 4 | Inf | 4 |
| doctor | 38.64686 | 3 | 2 | 3 | Inf | 5 | Inf | 4 |
| doctor | 38.97027 | 3 | 1 | 3 | Inf | 4 | Inf | 4 |
| doctor | 39.86742 | 3 | 2 | 3 | Inf | 5 | Inf | 4 |
| doctor | 41.19037 | 3 | 1 | 3 | Inf | 4 | Inf | 4 |
| doctor | 42.86897 | 3 | 0 | 3 | Inf | 3 | Inf | 4 |
| doctor | 43.89745 | 2 | 0 | 3 | Inf | 2 | Inf | 4 |
| doctor | 51.43846 | 1 | 0 | 3 | Inf | 1 | Inf | 4 |
| doctor | 61.20384 | 0 | 0 | 3 | Inf | 0 | Inf | 4 |
| doctor | 67.56626 | 1 | 0 | 3 | Inf | 1 | Inf | 4 |
| doctor | 68.15052 | 0 | 0 | 3 | Inf | 0 | Inf | 4 |
| doctor | 69.52374 | 1 | 0 | 3 | Inf | 1 | Inf | 4 |
| doctor | 30.00000 | 3 | 1 | 3 | Inf | 4 | Inf | 5 |
| doctor | 32.59593 | 3 | 0 | 3 | Inf | 3 | Inf | 5 |
| doctor | 33.65738 | 2 | 0 | 3 | Inf | 2 | Inf | 5 |
| doctor | 35.27459 | 3 | 0 | 3 | Inf | 3 | Inf | 5 |
| doctor | 41.59611 | 2 | 0 | 3 | Inf | 2 | Inf | 5 |
| doctor | 44.05495 | 3 | 0 | 3 | Inf | 3 | Inf | 5 |
| doctor | 45.40062 | 2 | 0 | 3 | Inf | 2 | Inf | 5 |
| doctor | 47.86583 | 1 | 0 | 3 | Inf | 1 | Inf | 5 |
| doctor | 54.93294 | 2 | 0 | 3 | Inf | 2 | Inf | 5 |
| doctor | 56.26097 | 3 | 0 | 3 | Inf | 3 | Inf | 5 |
| doctor | 56.92370 | 3 | 1 | 3 | Inf | 4 | Inf | 5 |
| doctor | 60.15735 | 3 | 2 | 3 | Inf | 5 | Inf | 5 |
| doctor | 60.80512 | 3 | 1 | 3 | Inf | 4 | Inf | 5 |
| doctor | 62.53120 | 3 | 0 | 3 | Inf | 3 | Inf | 5 |
| doctor | 66.24633 | 3 | 1 | 3 | Inf | 4 | Inf | 5 |
| doctor | 67.95916 | 3 | 0 | 3 | Inf | 3 | Inf | 5 |
| doctor | 68.57552 | 2 | 0 | 3 | Inf | 2 | Inf | 5 |
| doctor | 69.76202 | 1 | 0 | 3 | Inf | 1 | Inf | 5 |
kable(result[["run_results"]])| replication | arrivals | mean_wait_time_doctor | mean_time_with_doctor | utilisation_doctor | mean_queue_length_doctor | mean_time_in_system | mean_patients_in_system |
|---|---|---|---|---|---|---|---|
| 1 | 9 | 1.1561321 | 12.600360 | 0.7545527 | 0.3739683 | 6.972457 | 2.4937655 |
| 2 | 10 | 0.2185845 | 15.462225 | 0.8137894 | 0.7190226 | 7.019465 | 3.0715488 |
| 3 | 8 | 1.6612341 | 11.704709 | 0.8144131 | 0.2671798 | 10.033307 | 1.7999155 |
| 4 | 4 | 1.3862671 | 8.268402 | 0.5633356 | 0.9223766 | 8.714268 | 0.8490077 |
| 5 | 7 | 1.1383003 | 8.211288 | 0.8027837 | 0.1753468 | 8.159880 | 1.5179933 |
result[["patients_in_system"]] |>
  kable() |>
scroll_box(height = "400px")| time | count | replication |
|---|---|---|
| 30.75713 | 1 | 1 |
| 36.02984 | 2 | 1 |
| 45.41002 | 3 | 1 |
| 46.38228 | 2 | 1 |
| 47.09469 | 3 | 1 |
| 51.95749 | 2 | 1 |
| 52.97948 | 1 | 1 |
| 58.91726 | 2 | 1 |
| 60.38786 | 3 | 1 |
| 60.91823 | 4 | 1 |
| 61.21542 | 5 | 1 |
| 64.10899 | 6 | 1 |
| 65.33619 | 5 | 1 |
| 66.04652 | 4 | 1 |
| 34.95654 | 1 | 2 |
| 42.18289 | 2 | 2 |
| 42.92251 | 1 | 2 |
| 50.70005 | 2 | 2 |
| 52.48242 | 3 | 2 |
| 56.64556 | 4 | 2 |
| 56.90389 | 3 | 2 |
| 58.31782 | 4 | 2 |
| 58.71667 | 5 | 2 |
| 59.37100 | 4 | 2 |
| 61.47146 | 5 | 2 |
| 61.49116 | 6 | 2 |
| 64.59513 | 7 | 2 |
| 31.68591 | 1 | 3 |
| 33.62819 | 2 | 3 |
| 33.68054 | 1 | 3 |
| 39.55955 | 2 | 3 |
| 43.92088 | 3 | 3 |
| 44.62077 | 4 | 3 |
| 45.72654 | 3 | 3 |
| 53.91676 | 2 | 3 |
| 54.85752 | 3 | 3 |
| 57.04574 | 2 | 3 |
| 58.46069 | 1 | 3 |
| 59.64239 | 0 | 3 |
| 63.70977 | 1 | 3 |
| 67.52795 | 2 | 3 |
| 38.64686 | 1 | 4 |
| 39.86742 | 2 | 4 |
| 42.86897 | 1 | 4 |
| 61.20384 | 0 | 4 |
| 67.56626 | 1 | 4 |
| 68.15052 | 0 | 4 |
| 69.52374 | 1 | 4 |
| 35.27459 | 1 | 5 |
| 41.59611 | 0 | 5 |
| 44.05495 | 1 | 5 |
| 47.86583 | 0 | 5 |
| 54.93294 | 1 | 5 |
| 56.26097 | 2 | 5 |
| 56.92370 | 3 | 5 |
| 60.15735 | 4 | 5 |
| 60.80512 | 3 | 5 |
| 66.24633 | 4 | 5 |
| 67.95916 | 3 | 5 |
| 68.57552 | 2 | 5 |
| 69.76202 | 1 | 5 |
Explore the example models
Nurse visit simulation
![]() Click to visit pydesrap_mms repository
Click to visit pydesrap_mms repository
| Key files | simulation/param.pysimulation/summary_stats.pysimulation/runner.py |
| What to look for? | This is set up to run replications in parallel by default, as introduced on the Parallel processing page. |
![]() Click to visit rdesrap_mms repository
Click to visit rdesrap_mms repository
| Key files | R/parameters.RR/runner.R |
| What to look for? | This is set up to run replications sequentially by default, but has functionality for running in parallel as introduced on the Parallel processing page. This means some differences in set up (with sequential also using future_lapply in that case - see parallel page for more details). |
Stroke pathway simulation
![]() Click to visit pydesrap_stroke repository
Click to visit pydesrap_stroke repository
| Key files | simulation/parameters.pysimulation/runner.py |
| What to look for? | Like nurse visit simulation, this is also set up to support parallel processing. |
![]() Click to visit rdesrap_stroke repository
Click to visit rdesrap_stroke repository
| Key files | R/parameters.RR/runner.R |
| What to look for? | Like nurse visit simulation, this is also set up to support parallel processing. |
Test yourself
Extend your model to support multiple replications, as shown above.