Report
This page shares an example of the output report produced by this model and walks through each section.
View full report
The model produces a .docx report, which has been converted to a PDF and displayed below.
Walkthrough of report sections
Table 1
For each 1L treatment in each risk population, the associated costs and impact on quality of life are described. These are:
- Costs
- Life-years gained (LYG)
- Quality-adjusted life-years (QALYs)
- Incremental cots, LYG and QALYs - all from comparison against the reference treatment (sunitinib)
- Incremental cost-effectiveness ratio (calculated from incremental costs and QALYs), either from comparison against the treatment under investigation (cabozantinib plus nivolumab) or the reference treatment (sunitinib)
The treatments are ordered by cost (ascending). These are results from the base case (i.e. not the scenario analysis).
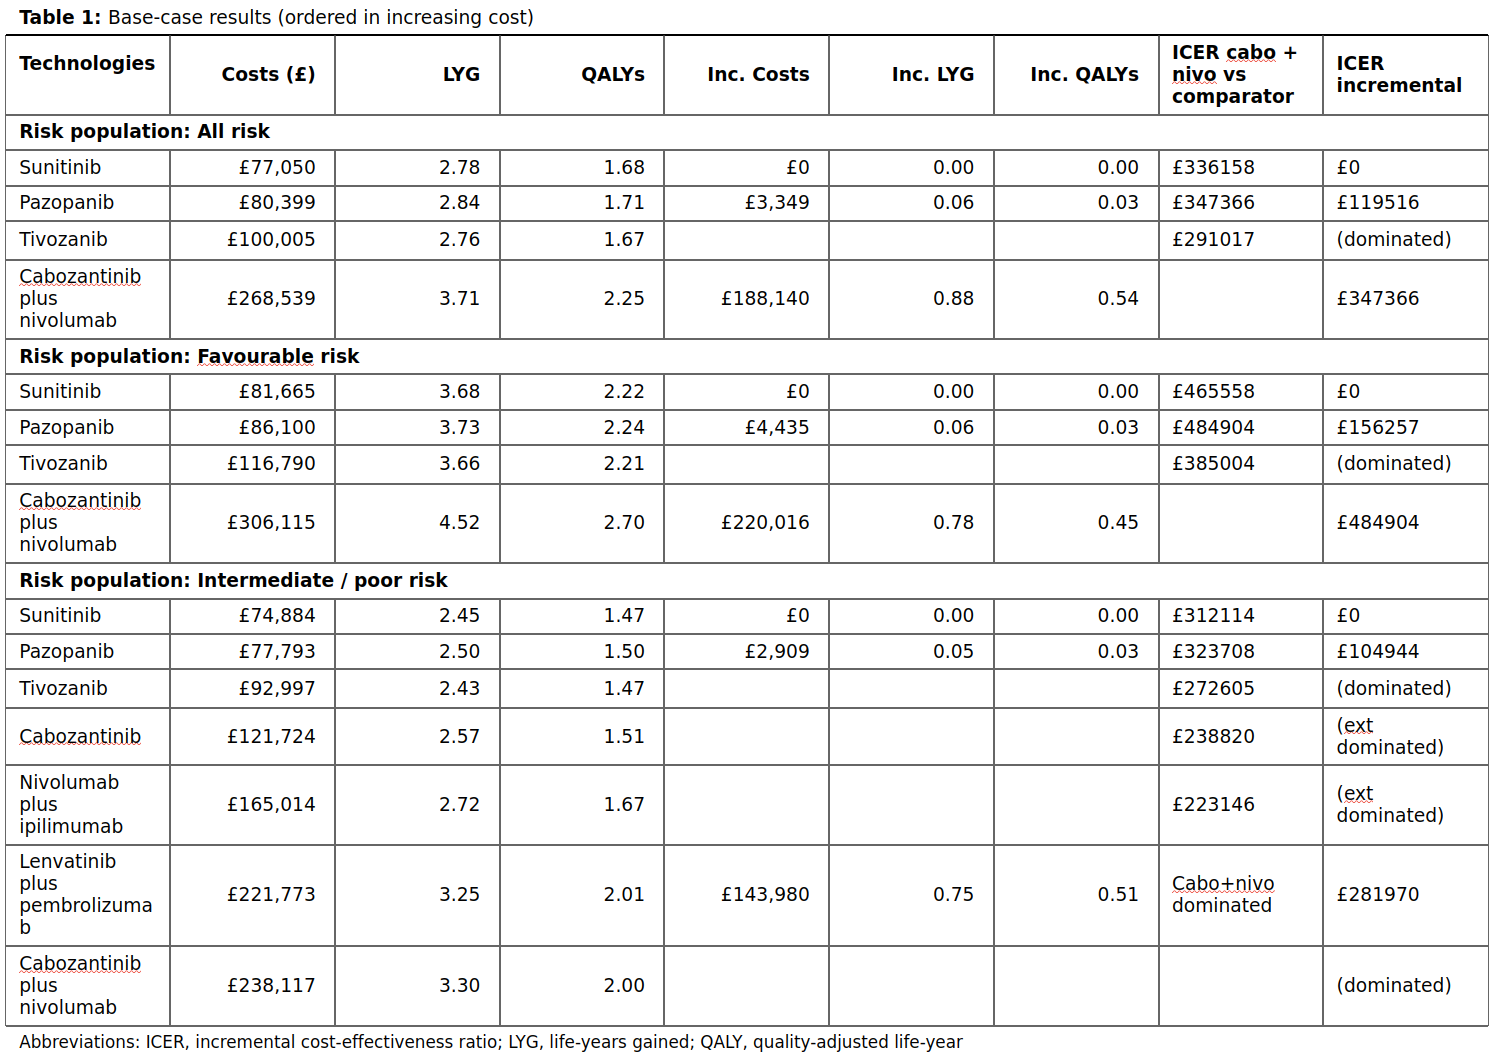
Table 2
As mentioned on the detailed summary page, a “severity modifier” refers to applying weights to QALYs for conditions that are more severe.
“Severity is measured in terms of absolute and proportional shortfall”. Absolute and proportional shortfall “both measure the difference between the number of QALYs patients would be expected to experience over the remainder of their lives under current care compared to the general population of the same age and sex”. [1]
Hence, this table presents the severity (described in terms of absolute and proportional shortfall) by different risk groups and choices of current care, and therefore the proposed modifier, depending on severity.
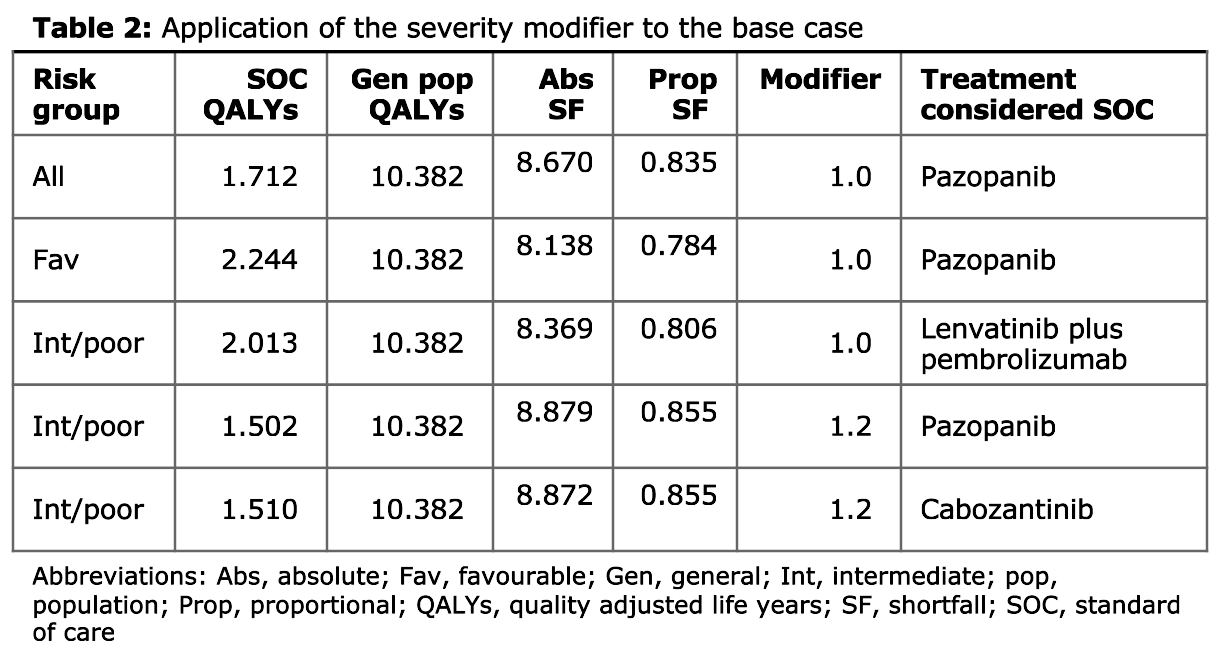
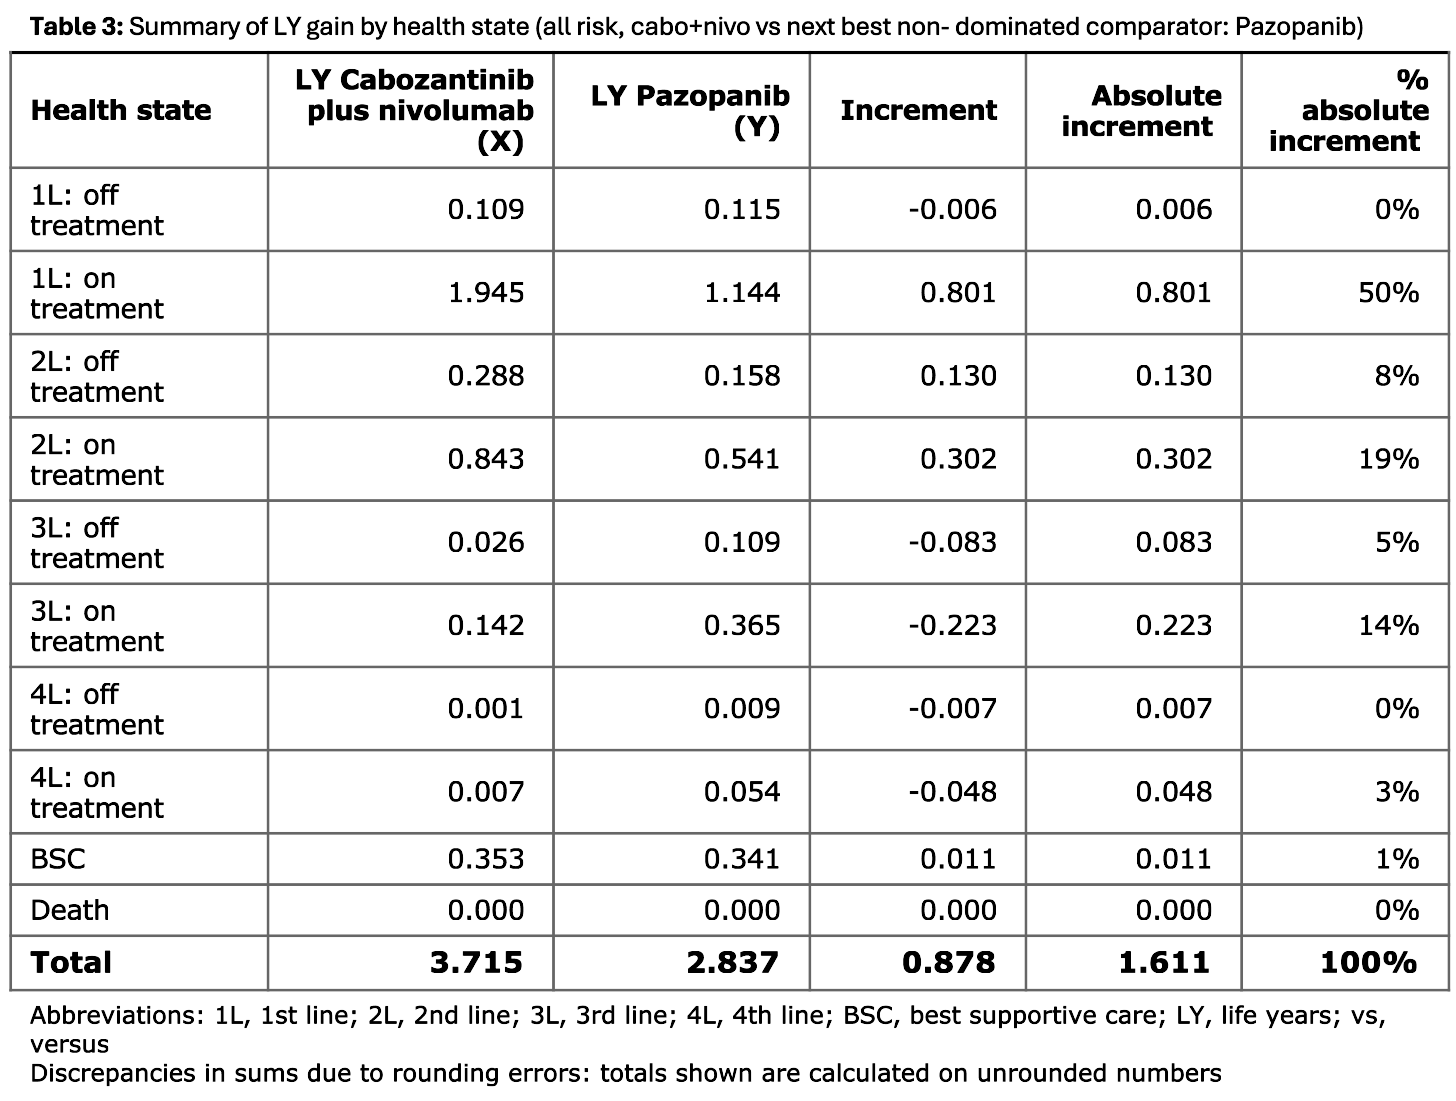
Table 3 to 5
These tables present the life years (LY) gained by health state, with results for each line of treatment (on or off), plus best supportive care (BSC) and death. They compare two treatment strategies marked X and Y.
- Table 3 is for the all risk group and compares cabozantinib plus nivolumab against pazopanib
- Table 4 is for the favourable risk group and also compares against pazopanib
- Table 5 is for the intermediate/poor risk group and the comparator is lenvatinib plus pembrolizumab.
Tables 6 to 8
These tables present the QALYs gained by health state. They likewise compare two treatment strategies, with tables for each of the risk groups, with comparators as in Tables 3 to 5.
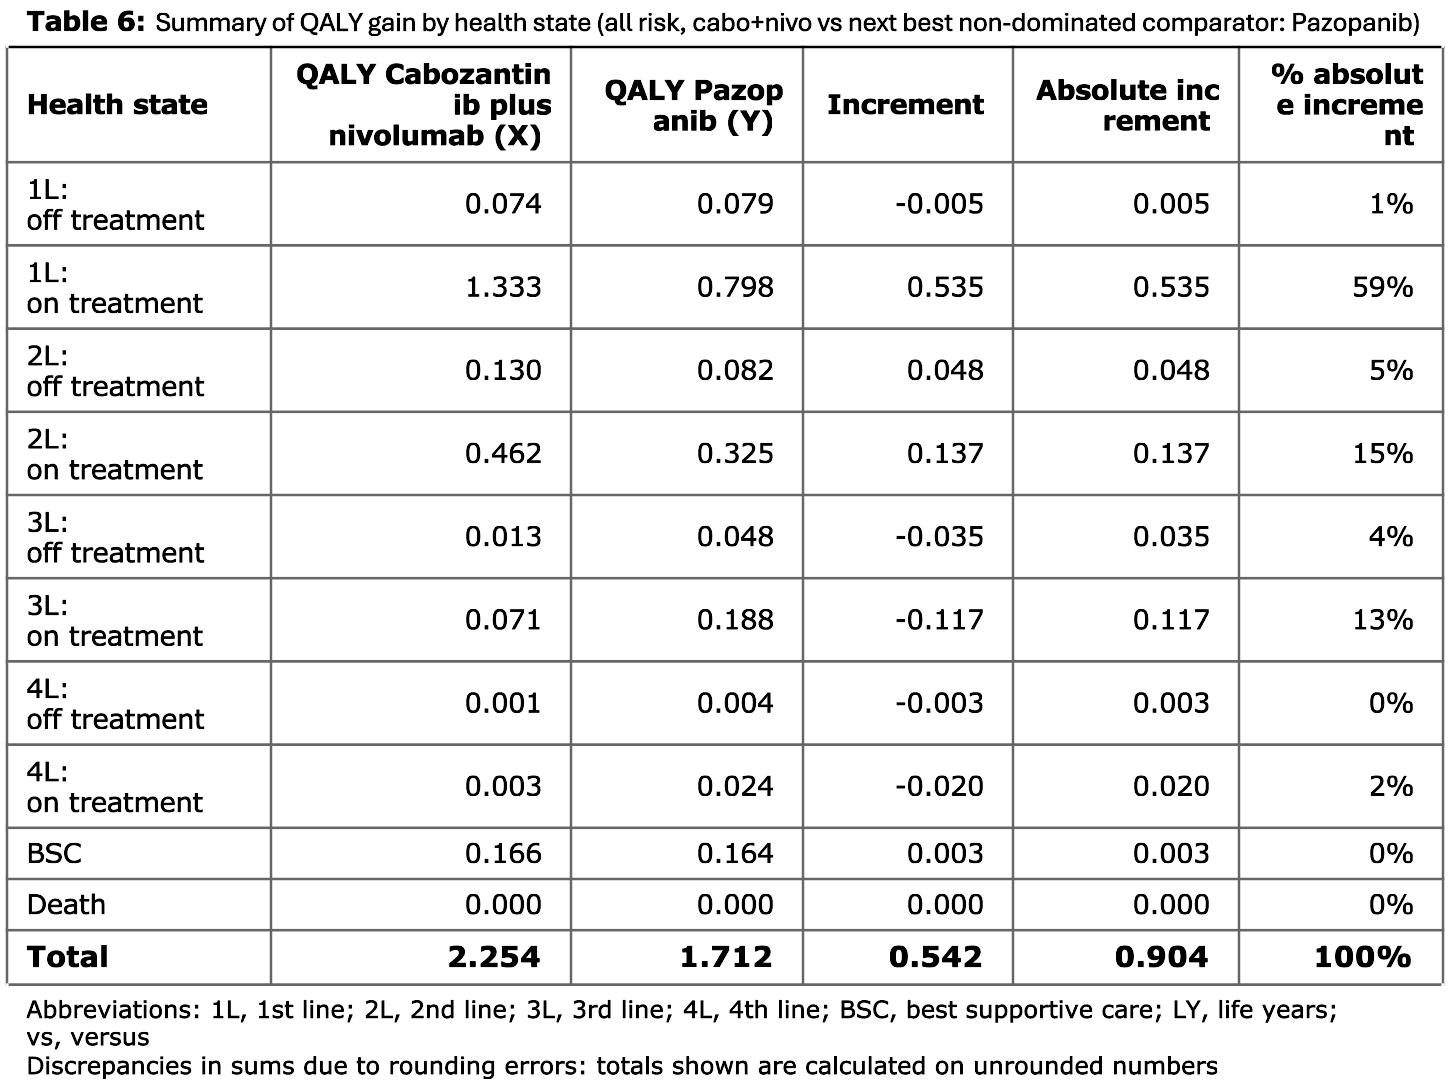
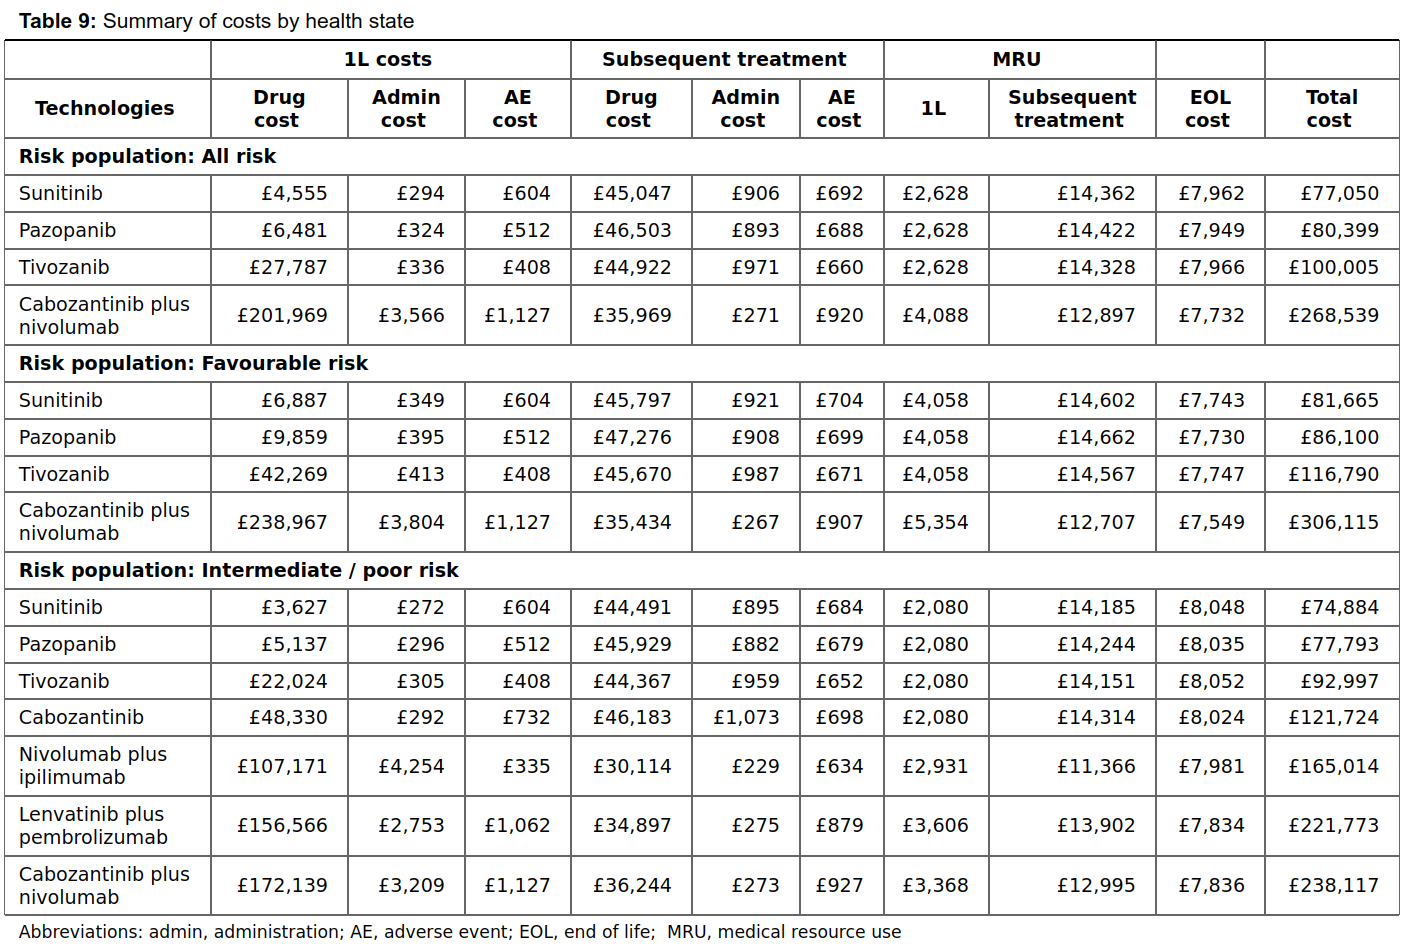
Table 9
Table 9 describes the costs and medical resource use for each risk population according to each 1L therapy received. It describes the:
- Costs and resource use for the 1L treatment
- Costs and resource use for the subsequent treatments
- Costs for end of life care
Costs for the 1L and subsequent treatment and broken down into drug costs, administration costs and adverse event costs.
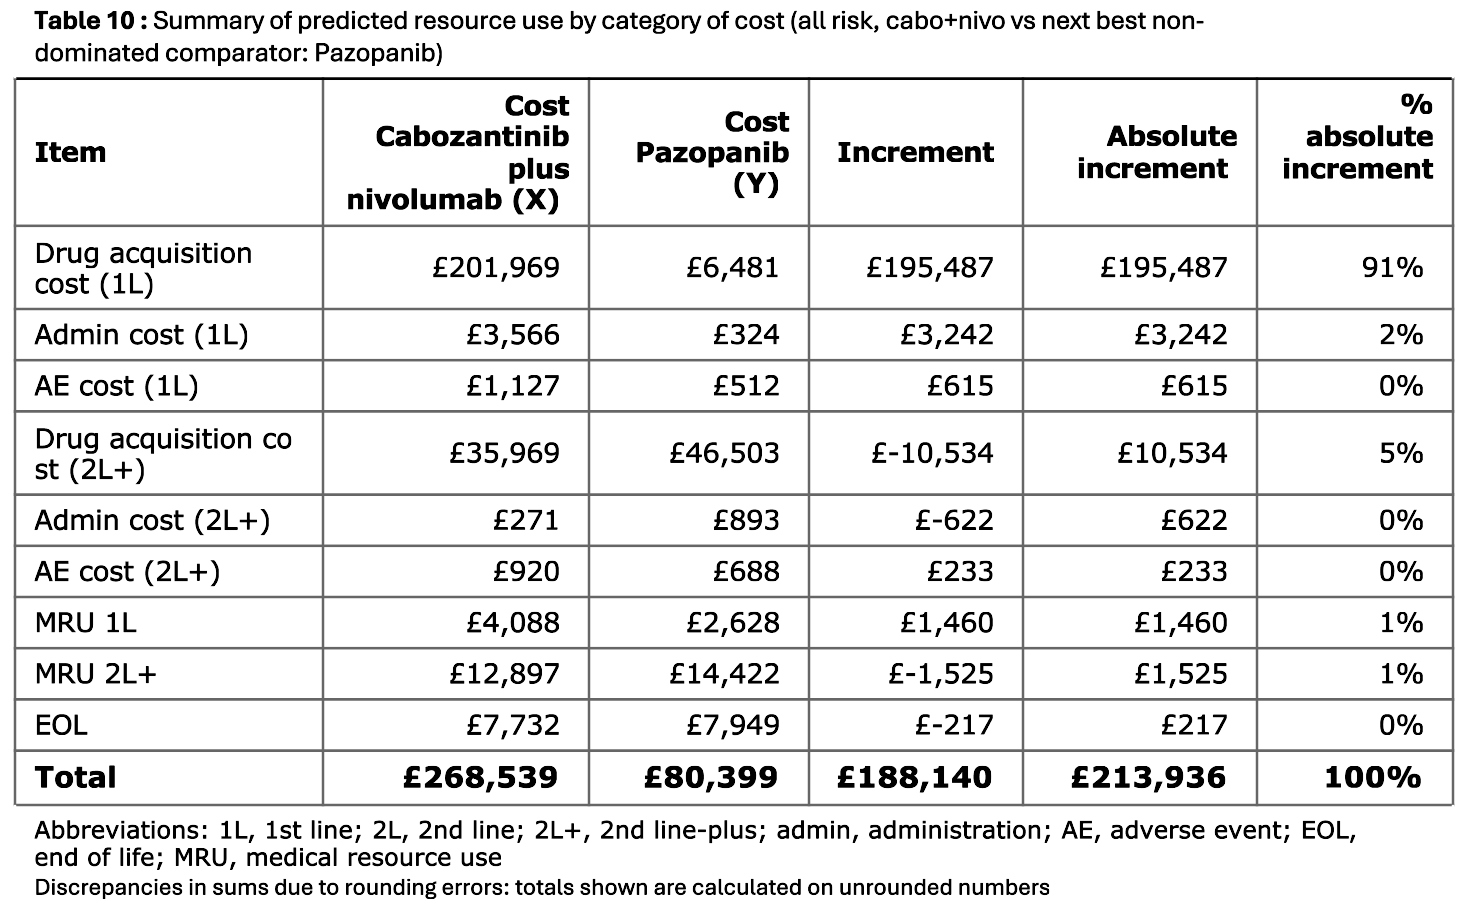
Tables 10 to 12
Tables 10 to 12 breakdown the costs and medical resource use, focusing on cabozantinib plus nivolumab against a reference treatment. It provides the costs and incremental costs.
There are tables for each risk group, with comparators as in Tables 3 to 5.
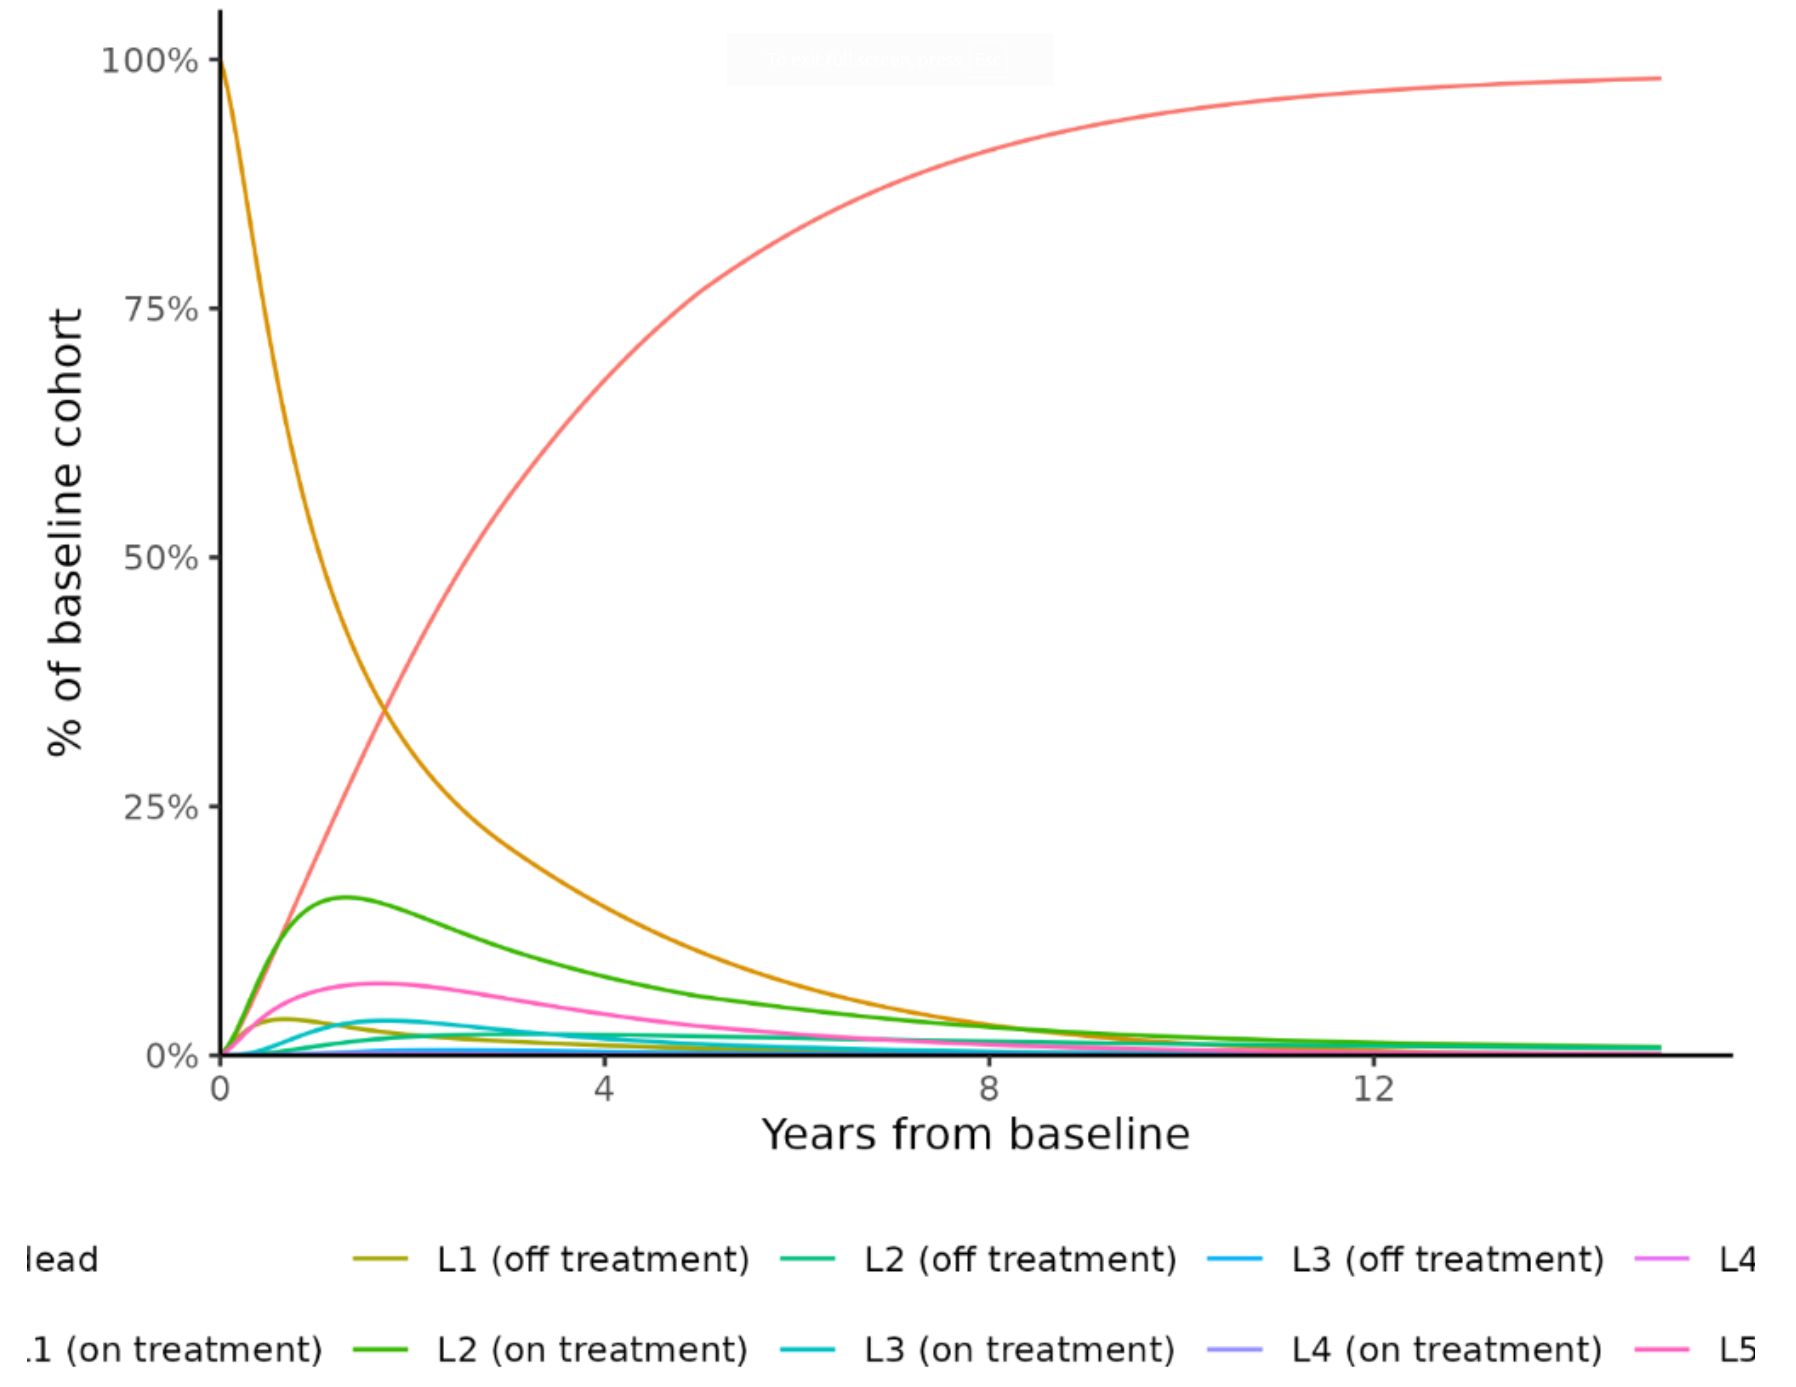
Figures 1 to 15
Markov traces are provided according to each of the 1L treatments in each risk population. These describe the proportion of patients simulated to be in each health state over time.
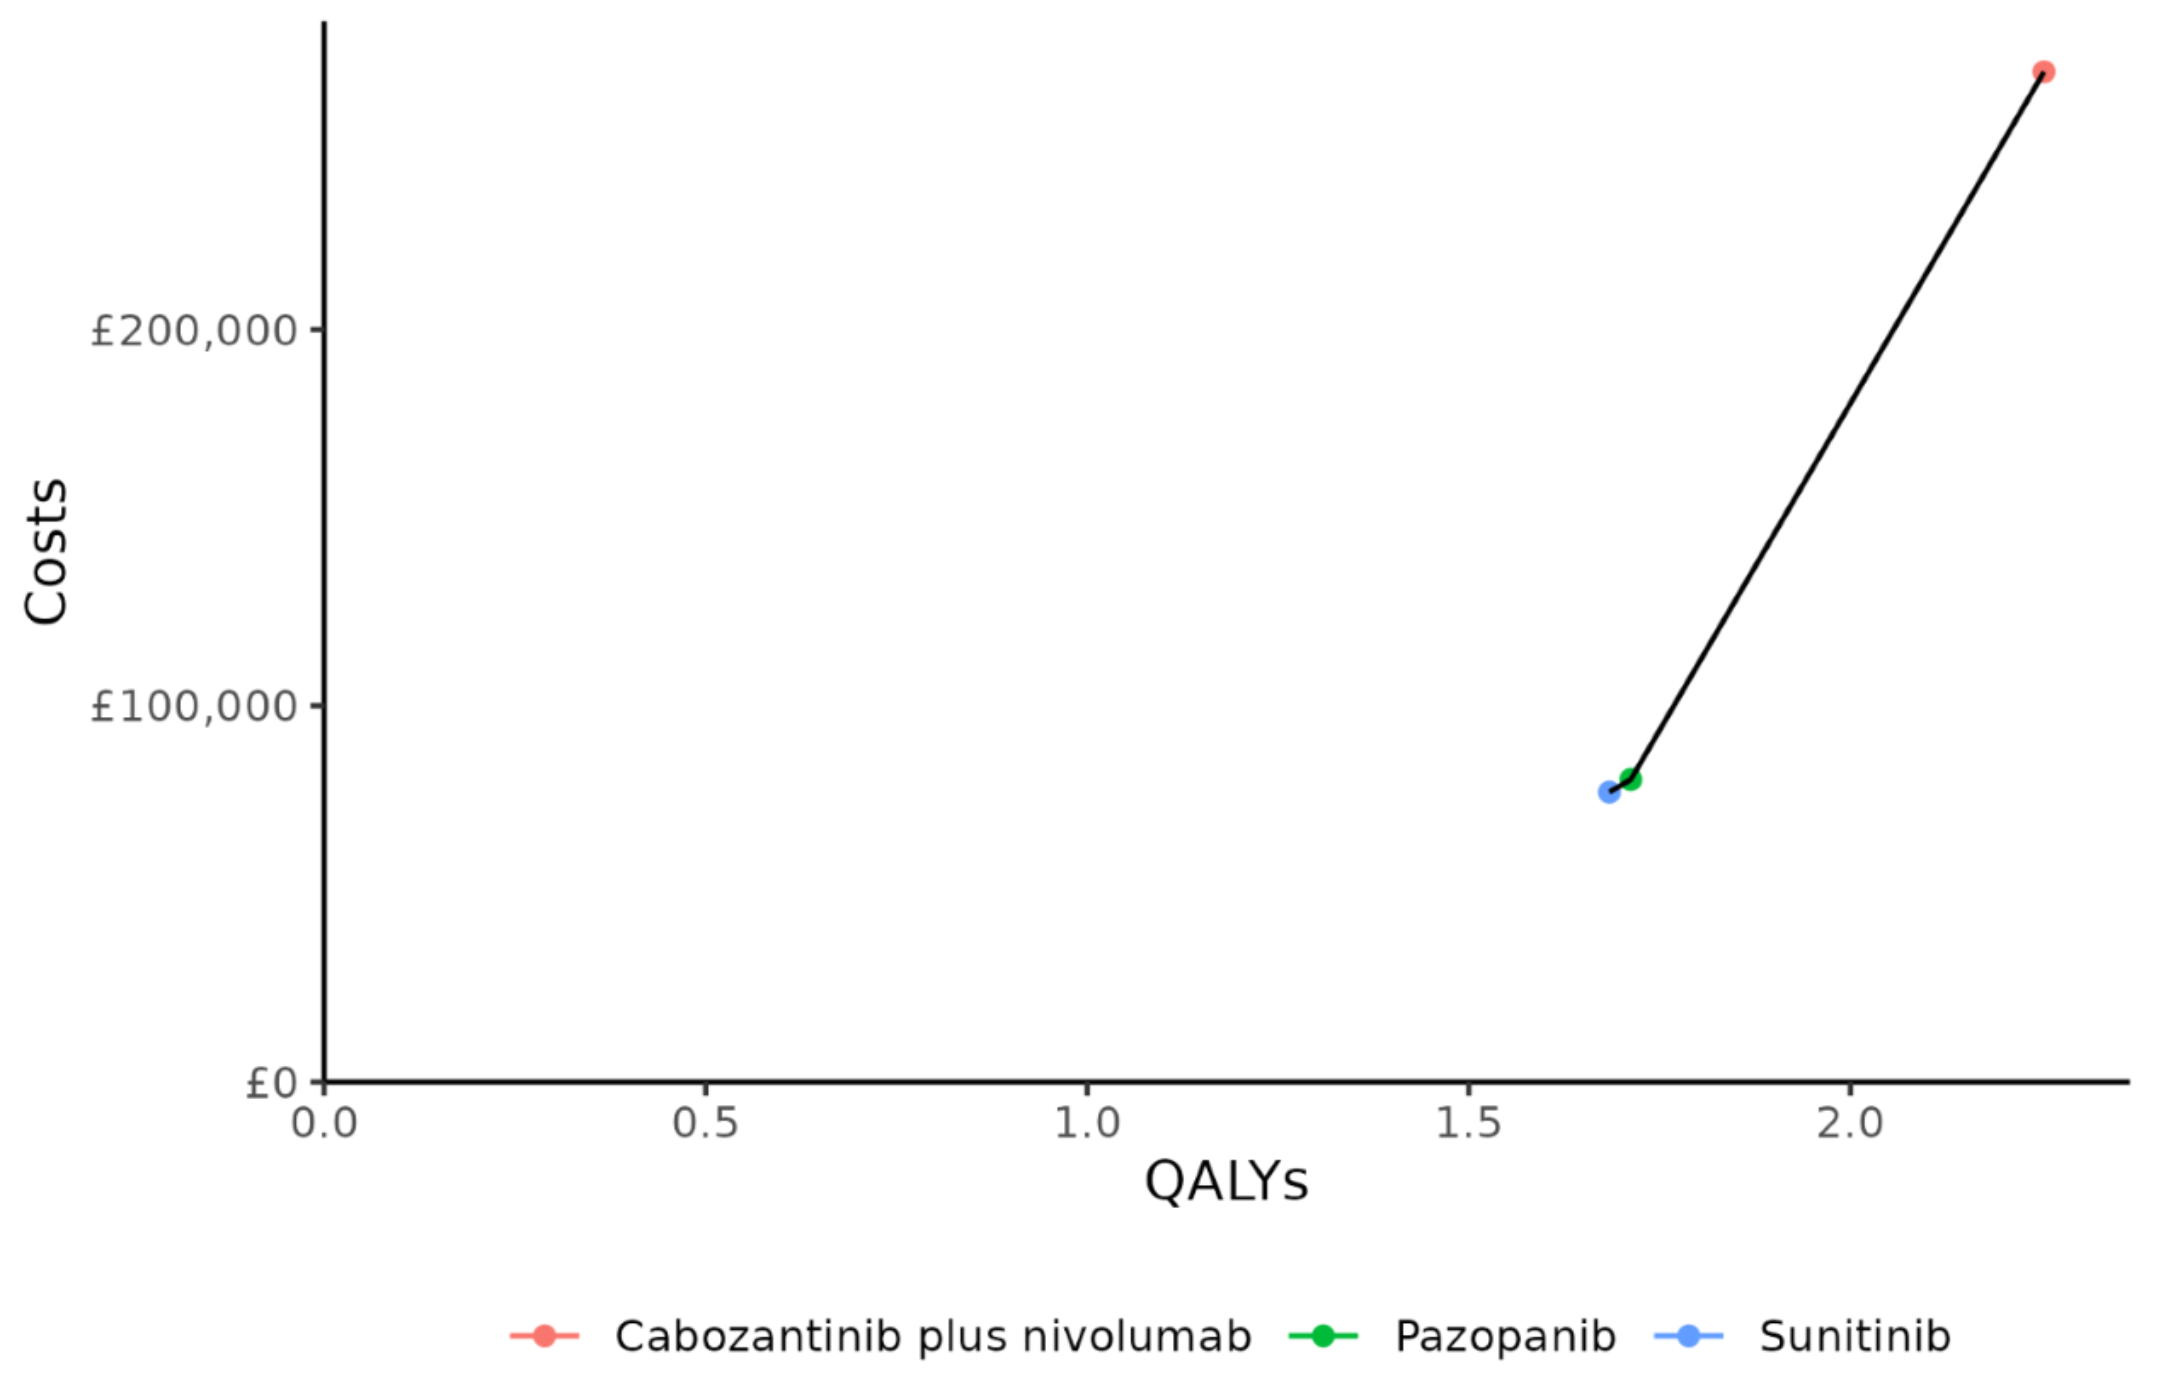
Figures 16 to 18
Figures 16 to 18 are the cost-effectiveness acceptability frontier (CEAF) for each of the risk populations. These are constructed by identifying the treatment with the lowest ICER, and then ruling out treatments that were less effective yet with a higher ICER (i.e. “dominated” treatments), and continuing until no treatments remain. What remains are the “non-dominated” treatments.
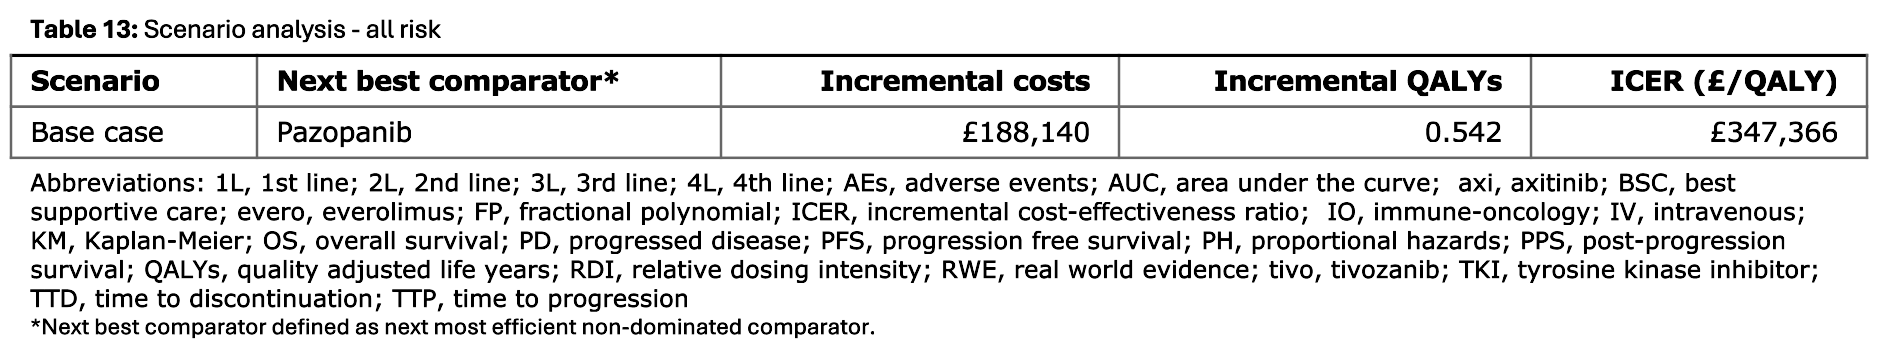
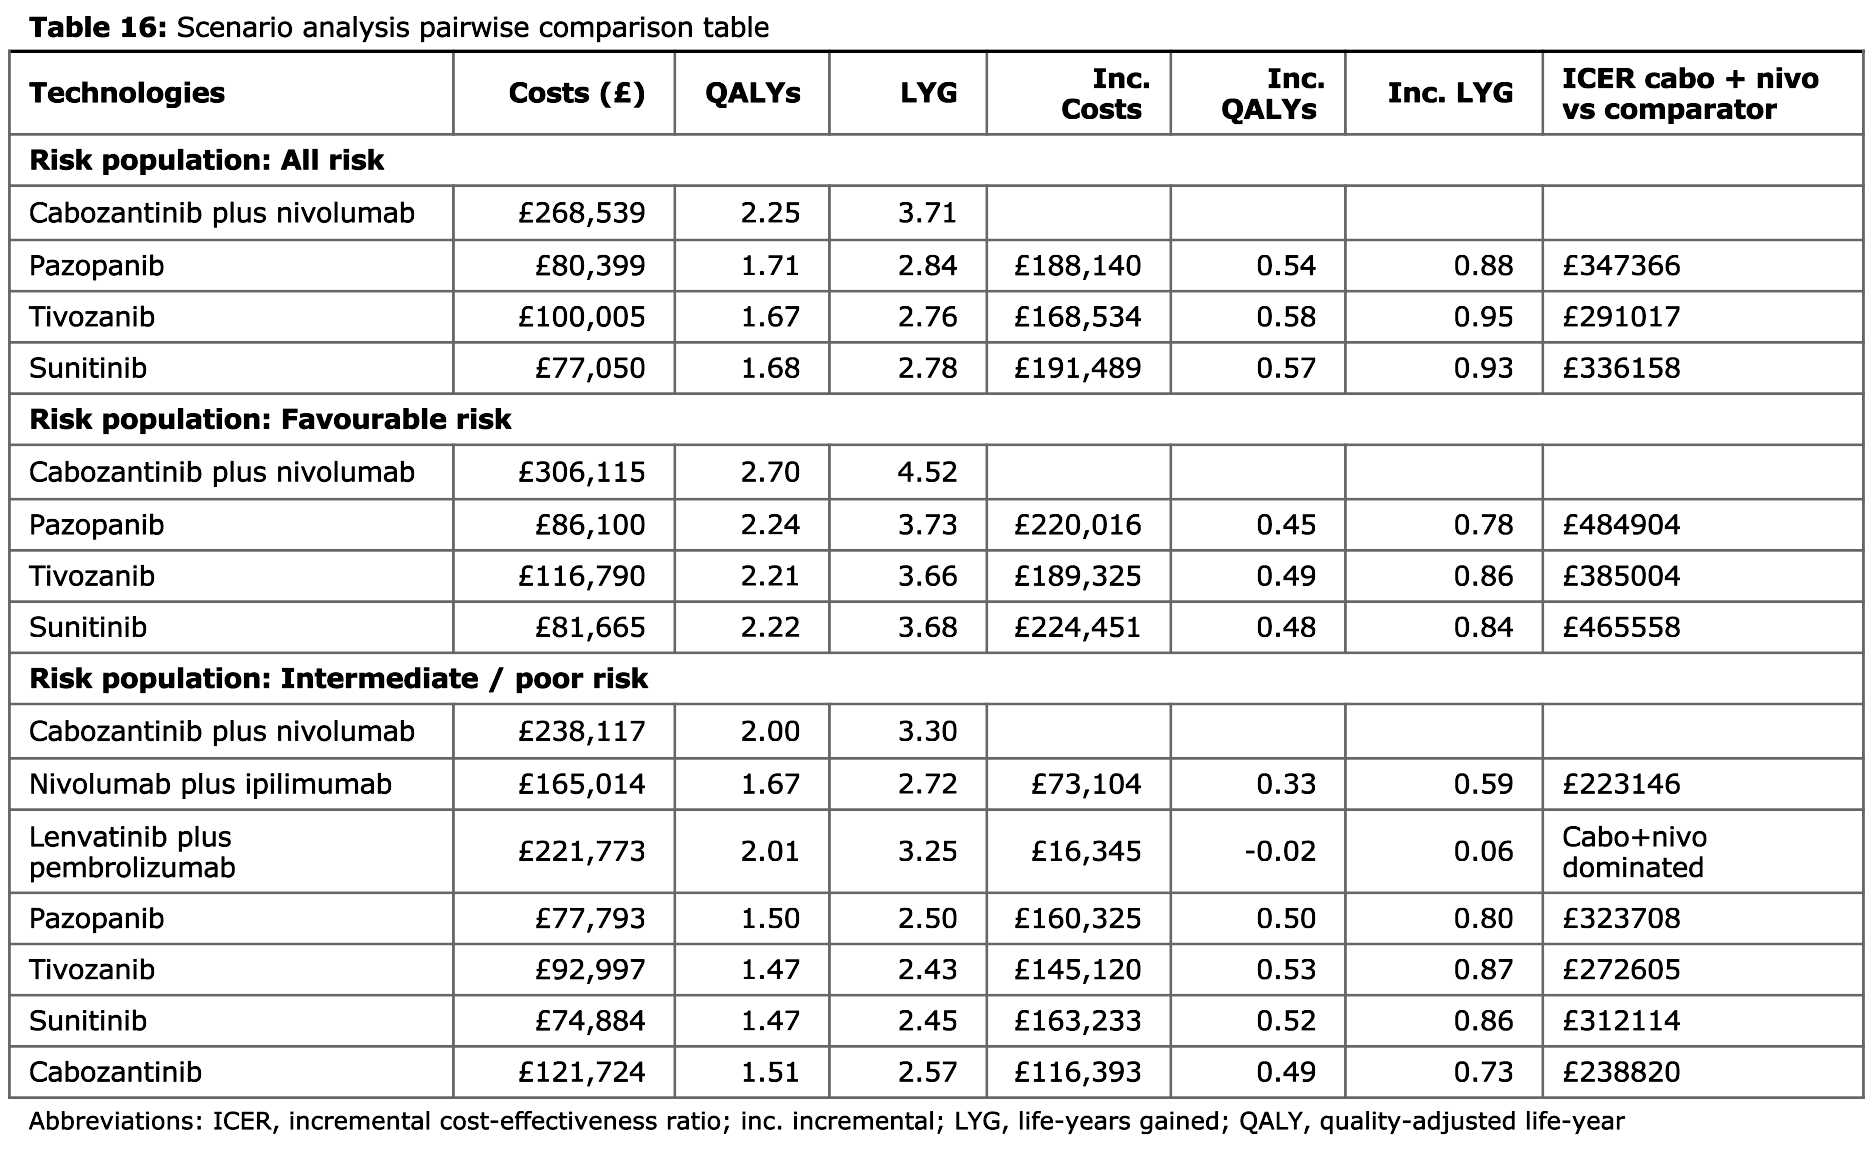
Tables 13 to 16
These tables would present the results of a scenario analysis if run but, in this example, only the base case was run. Hence, Tables 13 to 15 just have a single row with base case results, whilst Table 16 just presents base case results as in Table 1.
Viewing the report
The output report will be in .docx format, so this is best viewed within Microsoft Word. If viewed in LibreOffice, you may find the tables are misformatted (going outside the page margins so not visible). If viewed in Google Docs, you may find the figures are not visible/fail to correctly load.