Plain english summary
The analysis in this repository forms part of a technology appraisal by the National Institute for Health and Care Excellence. The purpose of an appraisal is to help inform whether the NHS should fund a new treatment. This is based on the cost-effectiveness of a treatment, as determined by comparing the health outcomes and costs resulting from this treatment, compared with other available treatments.
This appraisal evaluates a combination of two treatments: cabozantinib with nivolumab. It assesses whether these are cost-effective as a first-line treatment (i.e. the first treatment given for a disease, in otherwise untreated patients).
It is being evaluated in patients with renal cell carcinoma (RCC) which is a type of kidney cancer. Specifically, it focuses on patients with advanced RCC, which means the cancer has spread from their kidney to other areas of their body.
What does the analysis do?
This diagram provides a broad summary of the steps required to perform this cost-effectiveness analysis. These are described in further detail below.
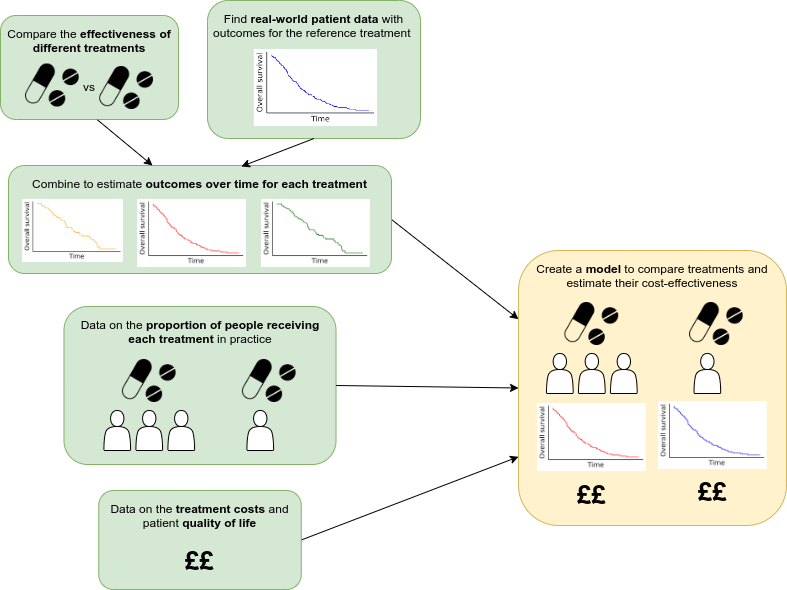
(1) Compare effectiveness of different treatments
Clinical studies that compared different treatments for advanced RCC were identified. These studies measured outcomes like how long people survived, whether their cancer progressed, and how well their cancer responded to the treatments. The studies also looked at side effects and how the treatments impacted patients’ quality of life.
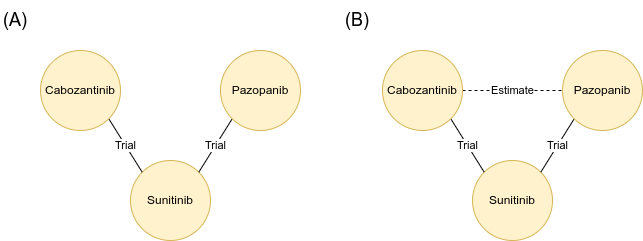
Some treatments were not directly compared in head-to-head trials. For example, cabozantinib and pazopanib were both compared to another drug, sunitinib, in separate studies, but not directly against each other (A).
In these cases, a method called “network meta-analysis” can be used to estimate how two treatments might have compared to one another, if they had been included head-to-head in a trial in real life. For example, estimating the effectiveness of cabozantinib versus pazopanib, based on what is known from their seperate comparisons with sunitinib (B).
(2) Get patient outcomes over time for reference treatment
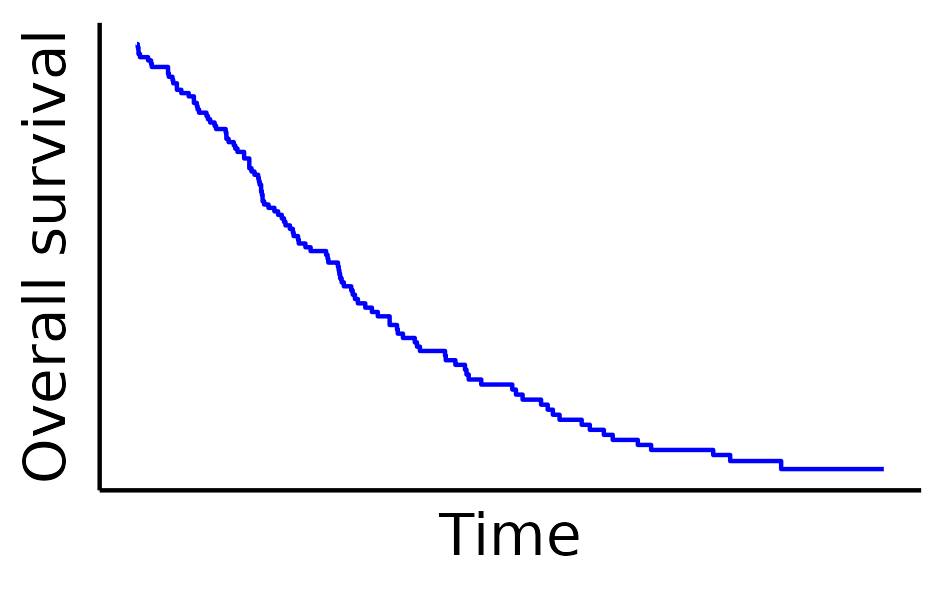
Studies were also found that looked at how advanced kidney cancer patients responded to treatments in the real world, outside of clinical trials. These studies provided data on things like how long patients survived and whether their cancer got worse.
For each stage of treatment (first-line, second-line, etc.), a “reference treatment” was chosen. This was the treatment most commonly used in practice. The outcomes for patients receiving those reference treatments were then taken from real-world data.
However, because the analysis needed to predict outcomes over a long period (40 years), and the real-world data didn’t cover that entire time, a technique called “survival analysis” was used. This method estimates long-term outcomes based on the patterns observed over the shorter period covered by the data.
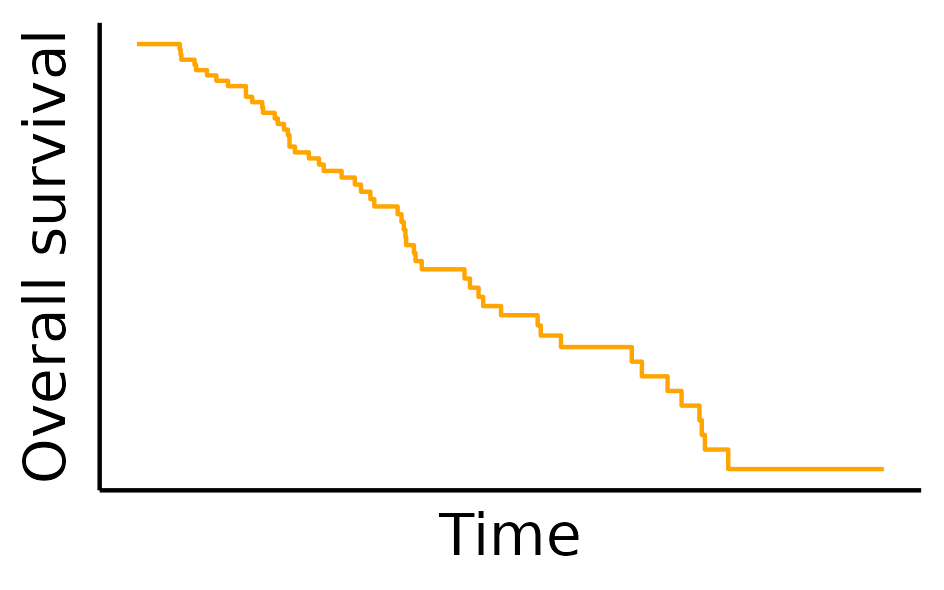
(3) Estimate outcomes over time for each treatment
Using the results from step (1), the real-world data can be adjusted to estimate how people might do on other treatments. This means we have predicted outcomes over time for each treatment, based on the comparison of effectiveness against the reference treatment.
(4) Find how many people receive each treatment
From the real-world data identified in step (2), we can also find the proportion of people that we expect to receive each treatment in practice.
(5) Get data on the cost and health utility of patients
For each treatment against advanced RCC, further studies were identified which reported either:
- The costs of each treatment for the healthcare system (e.g. costs of drugs, appointments, care)
- The quality of life for patients on or off each treatment at each line of therapy (first-line through to fourth-line). This is described using a measure called a “health utility value”.
- Utility values describe the health status of a person. They typically range from 1 (representing perfect health) to 0 (representing death). In some cases, values can fall below 0 (representing health states perceived to be worse than death). These values are determined by surveying people about their preferences between different health scenarios.
(6) Construct an economic model
The data from steps (3), (4) and (5) were then fed into a computer model. The model simulates what happens to groups of patients who receive each sequence of treatments: how long they live, how much their treatments cost, and what their quality of life is like. By comparing these results, decisions can be made as to which treatments offer the best combination of effectiveness and value for money.