Detailed summary
This repository contains code to support appraisal of the cost-effectiveness of treatments in advanced renal cell carcinoma. It is currently applied to an appraisal of cabozantinib and nivolumab. This application and an overview of the analysis and modelling steps performed are described below.
Background
Renal cell carnioma stages and risk groups
Renal cell carcinoma (RCC) is a type of kidney cancer. It is the most common type, accounting for over 80% of cases. The treatment strategy depends on RCC’s location and stage. The stages of RCC can be defined as:
| Stage 1 and 2 | Stage 3 | Stage 4 |
|---|---|---|
| Cancer is only in the kidney | Cancer may have spread to nearby lymph nodes | Cancer has metastasised, meaning it has spread to other areas of the body; Also known as advanced RCC (aRCC) |
People with aRCC who have not yet received systemic treatments (therapies that target cancer cells throughout the body) are classified as either being favourable-risk RCC or intermediate- and poor-risk RCC. These categories are defined in the International Metastatic Renal Cell Carcinoma Database Consortium (IMDC) criteria. They are established based on time from diagnosis, the patient’s ability to perform daily tasks, and some laboratory measurements. In the UK, most RCC patients are classified as intermediate or poor risk. Risk status is associated with clinical outcomes (for example, mortality rates). It is used to help guide decisions on which treatments to use.
For more information, see section 2.2 “Epidemiology” and 2.3.1 “Risk Status” in the Assessment Report. [1]
Focus of the appraisal
The analysis in this repository is related to the NICE appraisal TA964 [2] which assesses the clinical- and cost-effectiveness of cabozantinib with nivolumab as a first-line therapy for patients with aRCC.
This treatment is a combination of:
- Cabozantinib - oral, 40mg daily
- Nivolumab - intravenous, 240mg every 2 weeks or 480mg every 4 weeks
It is a first-line (1L) systemic therapy, meaning it is for previously untreated patients. They may then have up to 3 more treatments (referred to as second-line (2L), third-line (3L) and fourth-line (4L) therapies), or at any point, may instead transition to receiving best-supportive care (BSC).
The appraisal compares this treatment against other 1L treatments. When modelling this, it includes an assumption of the subsequent treatments that people might receive after each.
For more information, see section 3.2 “Interventions” and 3.3 “The RCC treatment pathway” in the Assessment Report. [1]
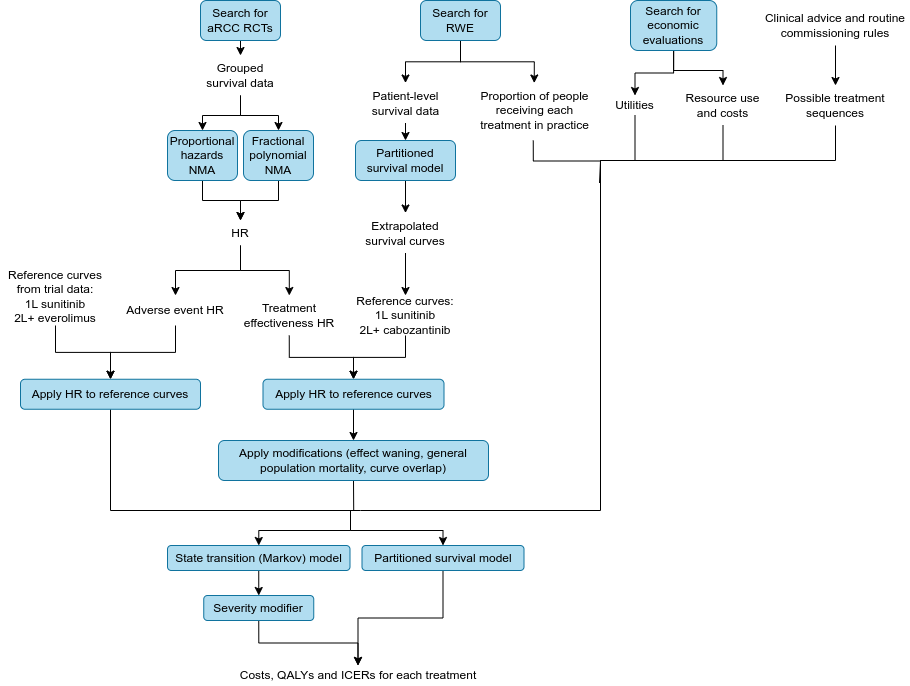
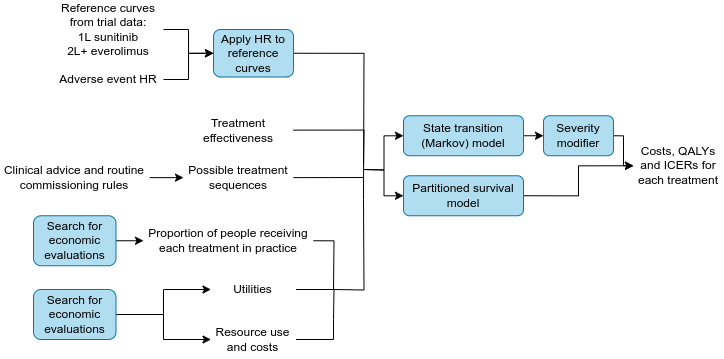
Summary diagram
Stage 1. Estimating the relative efficacy of each treatment
Identification of randomised controlled trials
A systematic review was conducted to identified randomised controlled trials (RCTs) of patients with aRCC who received any of the treatments under comparison - namely: cabozantinib plus nivolumab; pazopanib; tivozanib; sunitinib; cabozantinib; nivolumab plus ipilimumab; pembrolizumab and lenvatinib; axitinib; lenvatinib plus everolimus; everolimus; nivolumab; avelumab plus axitinib
The studies had to report at least one of the outcomes of interest:
- Overall survival (OS) - “time from randomisation to death” [3]
- Progression-free survival (PFS) - “time from randomisation until first evidence of disease progression or death” [3]
- Time to next treatment (TTNT) - “time from initiating treatment to initiating the next line of therapy” [3]
- Time on treatment - similar to TTNT, but excluding time off treatment between lines of therapy
- Response rates (also known as objective response rate) - the proportion of people with partial response (decrease in tumour size) or complete response (disappearance of all signs of cancer) [4]
- Duration of response - “time from randomisation to disease progression or death in patients who achieve complete or partial response” [3]
- Adverse events (AEs) of treatment - “undesired effect” of treatment [4]
- Health-related quality of life (HRQoL) - “the impact a medical condition and/or treatment has on a patient’s functioning and well-being” [5]
The review identified 24 RCTs to include (plus an additional 6, but these were ongoing). All 24 studies recorded OS, PFS, response rate and adverse events, whilst other outcomes were more sparsely recorded.
For more information, see section “3.1.1 Identification of systematic literature reviews and randomised controlled trials” and “Table 11 Outcomes reported by RCTs included in the review” in the Assessment Report [1] and section 1.8 “Literature review approach” in the Pathway Model Report. [6]
Network meta-analysis
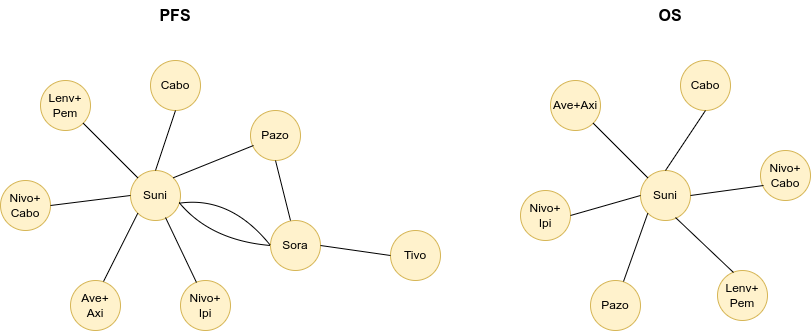
The identified trials do not all include the same treatments, with each comparing different therapies head-to-head. To illustrate this, below are 1L network diagrams for PFS and OS, as based on Figures 16 and 17 in the Assessment Report. [1] These show which treatments were directly compared head-to-head: each circle represents a treatment, and each line represents a clinical trial.
For our economic model, we need to understand the clinical effectiveness of each treatment for each outcome, relative to the other treatments. This is measured using hazard ratios (HR), which are “a measure of how often a particular event happens in one group compared to how often it happens in another group, over time”. [4]
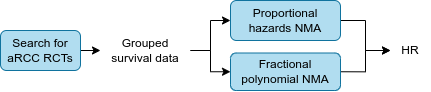
In order to estimate the comparative effectiveness of interventions that may not have been compared head-to-head in a randomised trial, network meta-analyses (NMA) were performed. Two types of NMA were used:
- Proportional hazards NMA (PH NMA) which returns a single hazard ratio for each comparison, as it “assumes the relative effects of each treatment… remain constant over time”
- Fractional polynomial NMA (FP NMA) which returns a list of time-varying hazard ratios for each comparison, as it “allows the relative effects to change over time” [6]
For each RCT, requests were made to the company that owned each trial’s data, asking for grouped survival data (in time intervals of 1 or 4 weeks), for used in the NMAs. If this was not received, then the published curves were digitised to estimate the grouped survival data.
NMA were performed for OS and PFS in the all-risk group, favourable-risk and intermediate- and poor-risk subgroups.
PH NMA and FP NMA were both conducted, but the chosen models used were:
- FP NMA for 1L efficacy - as the “flexible time-varying hazard ratios… provided a better, more plausible fit to observed short-term data” [6] and as the proportional hazards was violated for some 1L treatments. However, PH NMA was used for pembrolizumab plus lenvatinib, as FP NMA produced implausible results.
- PH NMA was used for 2L and 3L efficacy due to the “sparsity of the available network and extreme results within the fitted models” [1]
- 4L efficacy was based on 3L outcomes, applying the hazard ratio for the difference between pooled 3L and 4L outcomes
The description of NMA above pertains to the treatment effectiveness NMA, but NMA were also performed for safety data (adverse events). This is discussed in more detail below, but is referred to as using a time invariant NMA since adverse events were not available as time-to-event data, and so odds ratios were estimated.
For more information, see section 1.16 “Relative effectiveness” in the Pathway Model Report [6] and 4.3.5.2 “Calculation of relative treatment effectiveness” in the Assessment Report. [1]
Stage 2. Extrapolating survival curves from real-world evidence

Identification of RWE
A targeted search was conducted to identify RWE (i.e. observational studies describing outcomes in practice, outside of a trial setting). The search was for studies that included patients with aRCC and described at least one of:
- Treatment pathways
- Natural history of disease
- Patient characteristics
Of the 12 real-world datasets identified, only one was considered to be robust, relevant to the UK and suitable for use in the economic model. This was Challapalli et al. 2022. [7] The owners of this dataset provided access to patient-level data.
For more information, see section 1.12 “Real-world evidence” in the Pathway Model Report [6] and 3.1.2 “Identification of real-world evidence” in the Assessment Report. [1]
Extrapolation of RWE
The OS, PFS, time to discontinuation (TTD), time to progression (TTP) and post-progression survival (PPS) survival curves from Challapalli et al. 2022 [7] were extrapolated so that they covered the time horizon of the economic model, which was 40 years. Extrapolation was conducted using survival analysis (with a partitioned survival model).
For more information, see section 4.3.5.1 “Extrapolation of survival curves” in the Assessment Report [1] and section 1.13 “Baseline risk” in the Pathway Model Report. [6]
Stage 3. Applying NMA hazard ratios to RWE reference curves
Reference curves
For 1L, the reference treatment used was sunitinib as:
- It is used in UK practice for all risk groups
- It was the most common 1L treatment in the RWE
- It was the comparator for the most of the RCTs (see the network diagram above)
For 2L and 3L, the reference treatment used was cabozantinib as:
- It was the most common 2L and 3L treatment in the RWE
- “Data were mature compared to other treatments” [1]
The reference treatment was based on RWE as per recommendations from the NICE manual and other recent appraisals.
For BSC, data was pooled for all 4L patients post-progression survival.
For more information, see section 4.3.5 “Treatment effectiveness and extrapolation” in the Assessment Report [1] and sections 1.13 “Baseline risk” and 1.14 “Appropriateness” in the Pathway Model Report. [6]
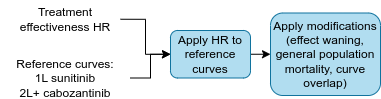
Applying the hazard ratios to the reference curves
The effectiveness of 1L sunitinib, 2L and 3L cabozantinib and BSC is provided by the RWE reference curves. For all other treatments, the effectiveness is calculated by applying the NMA HRs to the reference curves.
The source of the HRs for each treatment, line and outcome were as follows:
- PFS and OS from the NMA - FP NMA for 1L (with exception of pembrolizumab plus lenvatinib) and PH NMA for 2L and 3L
- Assume 1L pazopanib and tivozanib effectiveness are the same as sunitinib (as not available in NMA)
- Assume 2L/3L sunitinib and pazopanib effectiveness are the same as tizovanib (as not available in NMA)
- Assume 1L TTD and TTP are the same as PFS
- Assume 2L/3L TTP is the same as PFS, but for TTD apply a hazard ratio to the PFS, as calculated from the 1L treatments
- Calculate 4L outcomes by applying hazard ratio on 3L outcomes
In the code, the nested list containing the HRs and survival times for each treatment is referred to as a relative efficacy network, and when the hazard ratios are applied to the reference curve, this was described as propagating the network.
For more information, see section 4.3.5.2 “Calculation of relative treatment effectiveness” in the Assessment Report [1] and section 1.16 “Relative effectiveness” in the Pathway Model Report. [6]
Stage 4. Modifications to the extrapolations
Treatment effect waning
Treatment effect waning is when the hazard/survival for a treatment converges to the hazard/survival of the comparator. This was implemented in the base case by assuming that the hazards converge at 5 years for 1L combination therapies that included an immuno-oncology (IO) treatment and tyrosine kinase inhibitor (TKI) (for example, axitinib and avelumab). It was set at 5 years as that is when people stop having that therapy in clinical practice.
For more information, see section 1.22 “Treatment effect waning” in the Pathway Model Report [6] and 4.3.5.3 “Treatment effectiveness waning” in the Assessment Report. [1]
General population mortality
If aRCC patients were projected to live longer than the general population, this was corrected (hence, ensuring the aRCC OS never exceeds the general population). General population mortality was based on an age and sex matched-profile (against the 1L all risk population) using data from the Office for National Statistics (ONS). The approach used to derive the general population mortality estimates was to model the empirical age and sex distribution, as described in Lee et al. 2024. [8]
For more information, see section 4.3.5.4 “Accounting for general population mortality” in the Assessment Report. [1]
Overlapping curves
A known limitation of partitioned survival analysis (which was used to extrapolate the RWE) is that it can produce curves where PFS lies above OS (which is impossible in real-life). Hence, in cases where this occurs, it was adjusted so that:
- PFS <= OS
- PFS <= TTP
- TTD <= OS
For more information, see section 4.3.5.5 “Adjustment for curves crossing” in the Assessment Report. [1]
Stage 5. Preparation of other data for the economic models
Adverse events
As for the effectiveness outcomes from the NMA, the odds ratios for grade 3+ adverse events calculated in the NMA were applied to reference curves. For all grade adverse events, odds ratios from an NMA in a cochrane review were used. The reference curves (i.e. the baseline adverse event risk in the model) were:
- 1L - sunitib from Checkmate 9ER RCT
- 2L and 3L - everolimus from CheckMate 025 RCT
This is with the exception of cabozantinib plus nivolumab, whose rates were based directly on Checkmate 9ER RCT data.
Odds ratios were used for adverse events instead of hazard ratios, as these were only reported by trials as having happened or not, with no detail on when they occurred or how many. Hence, the NMA is referred to as a time invariant NMA. Meanwhile, treatment effectiveness is via hazard ratios, which are based on time-to-event data.
Whilst this describes the method used in the base case, a scenario analysis was performed to explore use of treatment-related naive adverse event rates instead.
For more information, see section 1.24 “Adverse events” in the Pathway Model Report [6] and 4.3.6 “Adverse events” in the Assessment Report. [1]
Utility values
For each line of treatment, there was a:
- Utility value for patients who were progression free
- Utility value for patients with progressed disease
- Utility value for BSC
The values were sourced from prior NICE technology appraisals - TA645 for 1L progression free and progressed and then for 2L to 4L from TA498 adjusting for the different starting utility in 1L progressed disease. These were identified through a systematic search for published cost-effectiveness studies.
Utility values were adjusted for age and sex using Ara and Brazier et al. 2010 [9] / 2011 [10] and the Health Survey England (HSE) 2014 dataset.
For more information, see sections 1.25 “Health-related quality of life” and 1.26 “Source of utility values” in the Pathway Model Report [6] and sections 4.1 “Published cost-effectiveness studies” and 4.3.7 “Utility values” in the Assessment Report. [1]
Resource use and costs
Similar to the utility values, resource use was based on prior NICE technology appraisals, whilst costs were based on NHS reference costs and costs from the Personal Social Services Research Unit. These include estimates of resource use and costs for:
- Disease management/health state (i.e. consultant and specialist nurse visits, CT scans, blood tests, pain medication)
- End of life (i.e. GP appointments, district nursing care, social care, hospital care)
- Drug and administration (i.e. costs of each drug)
- Adverse events (e.g. Grade 1/2 events like diarrehoea or fatigue, and Grade 3+ events like anaemia, hypertension and nausea)
- Subsequent treatment (i.e. radiotherapy, surgery)
For more information, see section 4.3.8 “Resource use and costs” in the Assessment Report [1] and sections 1.27 “Resource use” and 1.28 “Relative dose intensity” in the Pathway Model Report. [6]
Treatment sequences
A list of possible treatment sequences was defined based on rules which were established based on clinical advice and routine commissioning rules. These rules are listed in section 4.3.5.6 “Calculation of final outcomes by first line treatment” in the Assessment Report. [1] Some examples include:
- Nivolumab plus ipilimumab 1L is only available to intermediate/poor risk patients
- Immuno-oncology treatments can’t be repeated if an immuno-oncology treatment was used in the past year in the adjuvant setting or in an earlier line as a systemic treatment
- Lenvatinib plus everolimus can only be used after one prior anti-vascular endothelial growth factor (anti-VEGF) treatment
Proportion of people receiving each treatment in practice
The proportion of people receiving each treatment in the model is based on the observed practices in the RWE.
For more information, see section 4.3.1.8 “EAG model structure” in the Assessment Report [1] and section 1.23 “Sequencing subsequent treatments” in the Pathway Model Report. [6]
Stage 6. Economic models
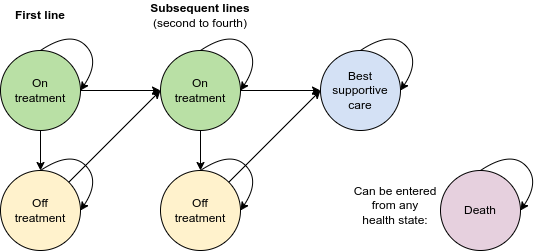
Model diagram
The economic model is designed to model up to four lines of treatment before BSC. A diagram of the model is provided below. There are ten possible health states:
- 1L off or on treatment
- 2L off or on treatment
- 3L off or on treatment
- 4L off or on treatment
- BSC
- Death
Transition between lines of treatment can be defined by either progression-free survival (PFS) or time to next treatment (TTNT).
For more information, see section 4.3.1.8 “EAG model structure” in the Assessment Report [1] and 1.6 “Economic model structure” in the Pathway Model Report. [6]
Methodology
Two modelling approaches were explored, with the creation of:
- A state transition model (i.e. a Markov model)
- A partitioned survival model (i.e. partitioned surival analysis)
The models were used within the NICE appraisal to estimate the costs and benefits of cabozantinib plus nivolumab, compared against other 1L treatments, whilst also incorporating information on the subsequent treatment pathways. People in the models started on 1L treatment. The models ran with weekly cycles over a 40 year time horizon. Costs and outcomes were discounted at a rate of 3.5% per year.
The committee preferred the state transition model as it allowed multiple treatment lines to be modelled in as much detail as possible (with a state transition model being more flexible and able to explore more uncertainties and alternative assumptions).
For more information, see section 1.6 “Economic model structure” in the Pathway Model Report [6] and 4.3 “EAG economic analysis” in the Assessment Report. [1]
Stage 7. Processing model results
The models simulate how a cohort of patients would transition between health states over the time horizon, depending on which treatments they received. It returns the proportion of patients over time in each health state. We then apply:
- Costs
- Utilities, with quality-adjusted life years (QALYs) calculated from multiplying the years in a health state by the utility score
An incremental cost-effectiveness ratio (ICER) can be calculated from the difference in costs divided by the difference in QALYs, and these can be compared between treatments.
Severity modifier
A greater weight can be given to QALYs if the treatment is for a condition with a high degree of severity, and this is referred to as a severity modifier. It was implemented for the state transition model, meaning that the results included absolute and proportional shortfall estimates of QALYs. Three methods were explored for calculating the severity modifier.
For more information, see section 1.29 “Severity” in the Pathway Model Report [6] and 4.3.9 “Severity” in the Assessment Report. [1]