Fixed model so that it is reproducible between runs. Total time used: 5h 45m (14.4%)
Work log
Untimed - Revision on random numbers
Spent some time revises how number generation works in Python - notes here. I felt this was external to reproducing the model, so did not include it in time.
If I would have timed it though, it would’ve been apx. 9.30-11.28.
11.29-12.38 Reproduction
I returned to trying to modify the code so it can reproduce results between runs.
A simple fix of adding a seed to some of the Uniform() functions that were still using random_seed=None meant that the simulation would now run exactly the same each time.
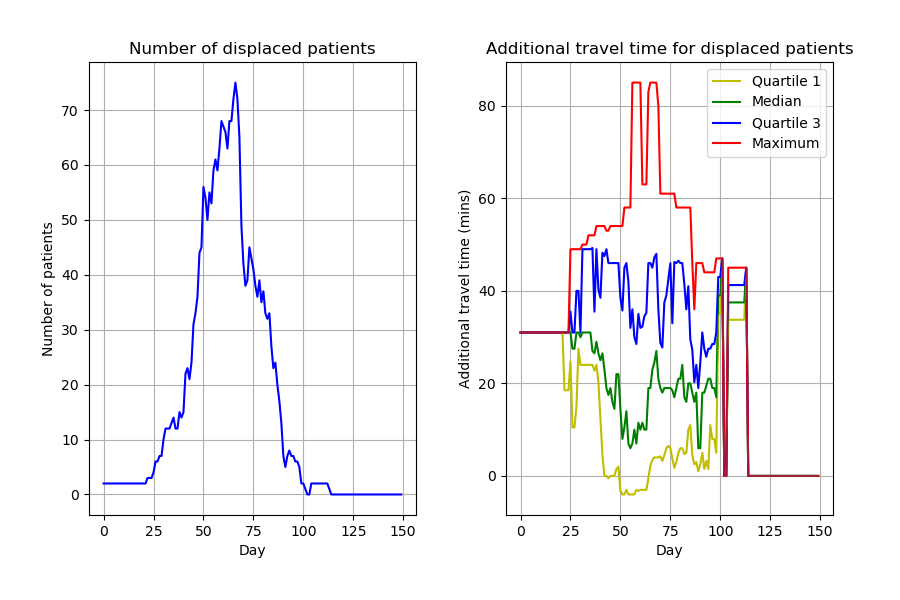
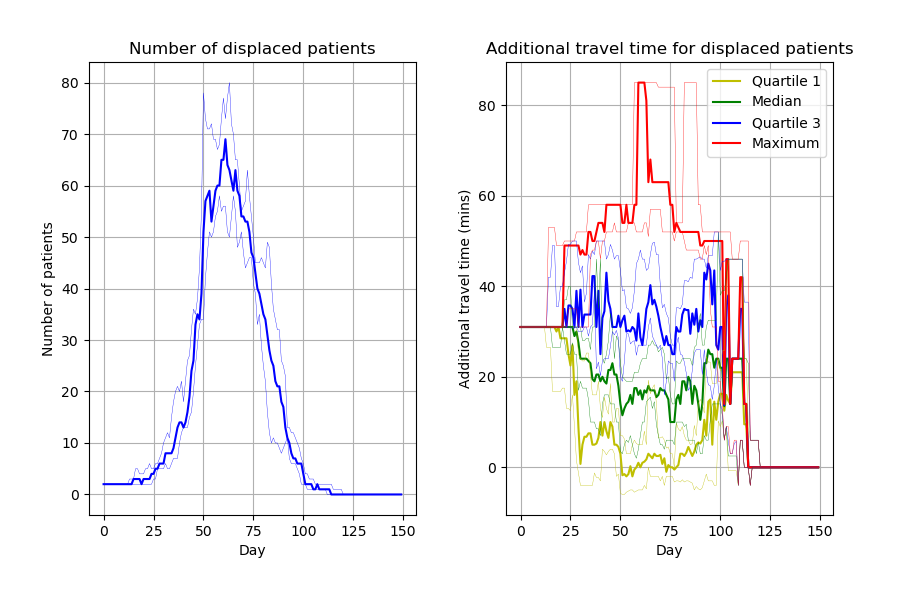
Run 1:
Run 2:
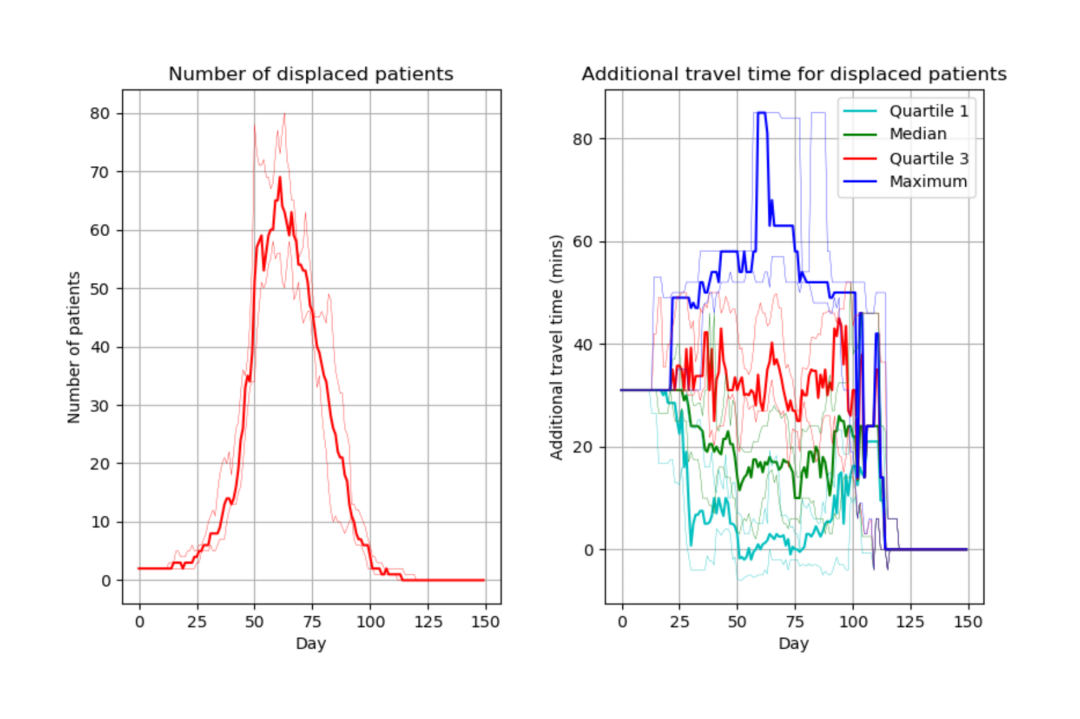
Then we needed a seperate seed with each run (else every run will produce identical results) This required changes to:
single_run() within sim_replicate.py so it can accept random number set as an argument, and then when it was called in multiple_replications(), to use the rep number as the starting seed
Scenario, changing it from a frozen dataclass to a class with a function that accepts a random number set, and then prompts generation of distributions from that
As can see, this has fixed it, as we have reproducible results between runs, and varying results within runs.
Run 1:
Run 2:
Untimed: Exploring methods for overlaying figures
Exploring methods for overlaying figures. Not timed as not about reproduction of this study, but about how we are going to do this each time when reproducing.
Decided that it’s not helpful to do this - spend more time fiddling around with getting them to resize and overlay correctly - and that the simplest option here would be to compare by eye.
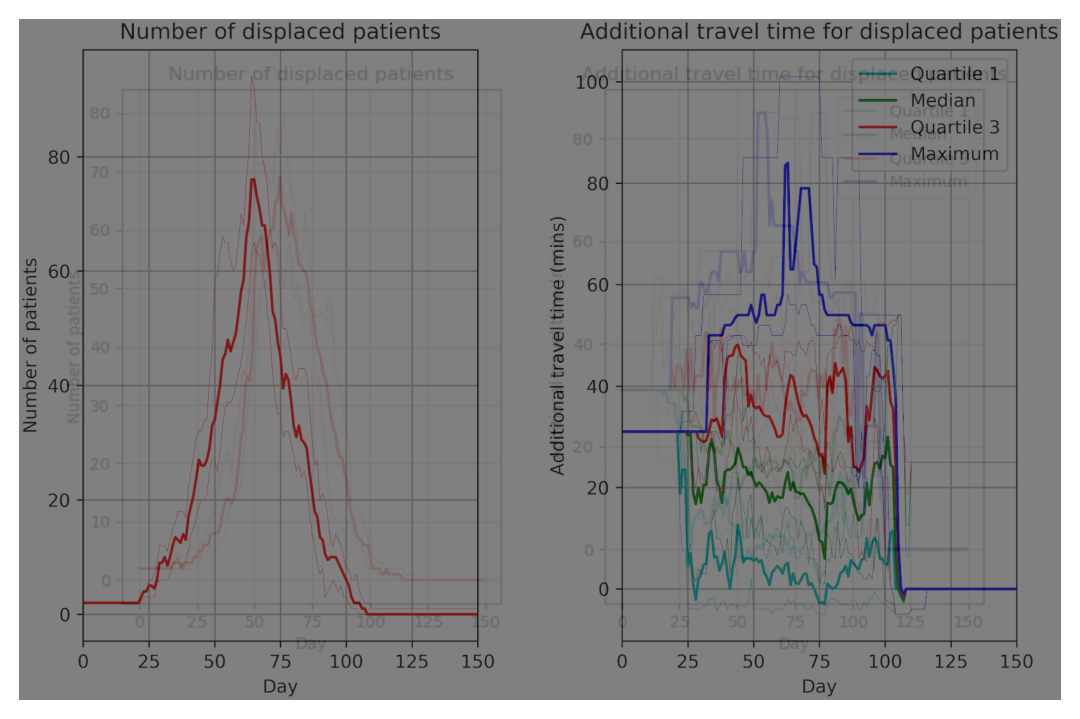
import cv2import matplotlib.pyplot as pltoriginal = cv2.imread('../../../original_study/article_fig4.png')overlay = cv2.imread('figure_2a.png')# Resize overlay to match original image dimensionsoverlay_resize = cv2.resize(overlay, (original.shape[1], original.shape[0]))# View new imageimg = plt.imshow(overlay_resize)plt.axis('off')img
# Overlay transparentlycombined = cv2.addWeighted(original,0.4,overlay_resize,0.1,0)# View new imageimg = plt.imshow(combined)plt.axis('off')img
Timings
import syssys.path.append('../')from timings import calculate_times# Minutes used prior to todayused_to_date =276# Times from todaytimes = [ ('11.29', '12.38')]# Print time used and remainingcalculate_times(used_to_date, times)
Time spent today: 69m, or 1h 9m
Total used to date: 345m, or 5h 45m
Time remaining: 2055m, or 34h 15m
Used 14.4% of 40 hours max
Suggested changes for protocol/template
✅ = Made the change.
💬 = Noted to discuss with team.
Protocol:
💬 Protocol should more clearly state if certain timestamps are needed. Currently the suggestion is time to create each figure - but is this definitely our focus? Or is it instead, time to set up the environment, time to get the simulation running, time to get it to reproduce between runs, time to successful reproduction. For this study, the figure from Krafczyk wouldn’t make alot of sense, as we all-or-nothing reproduce them. Depending on decision, need to be clear in protocol about what is being timed and what is not.
References
Allen, Michael, Amir Bhanji, Jonas Willemsen, Steven Dudfield, Stuart Logan, and Thomas Monks. 2020. “A Simulation Modelling Toolkit for Organising Outpatient Dialysis Services During the COVID-19 Pandemic.”PLOS ONE 15 (8): e0237628. https://doi.org/10.1371/journal.pone.0237628.