README for reproduction
This page contains a copy of the README produced to support reproduction
COVID-19 Dialysis Service Delivery Model
Model summary
Allen, M., Bhanji, A., Willemsen, J., Dudfield, S., Logan, S., & Monks, T. A simulation modelling toolkit for organising outpatient dialysis services during the COVID-19 pandemic. PLoS One 15, 8 (2020). https://doi.org/10.1371%2Fjournal.pone.0237628.
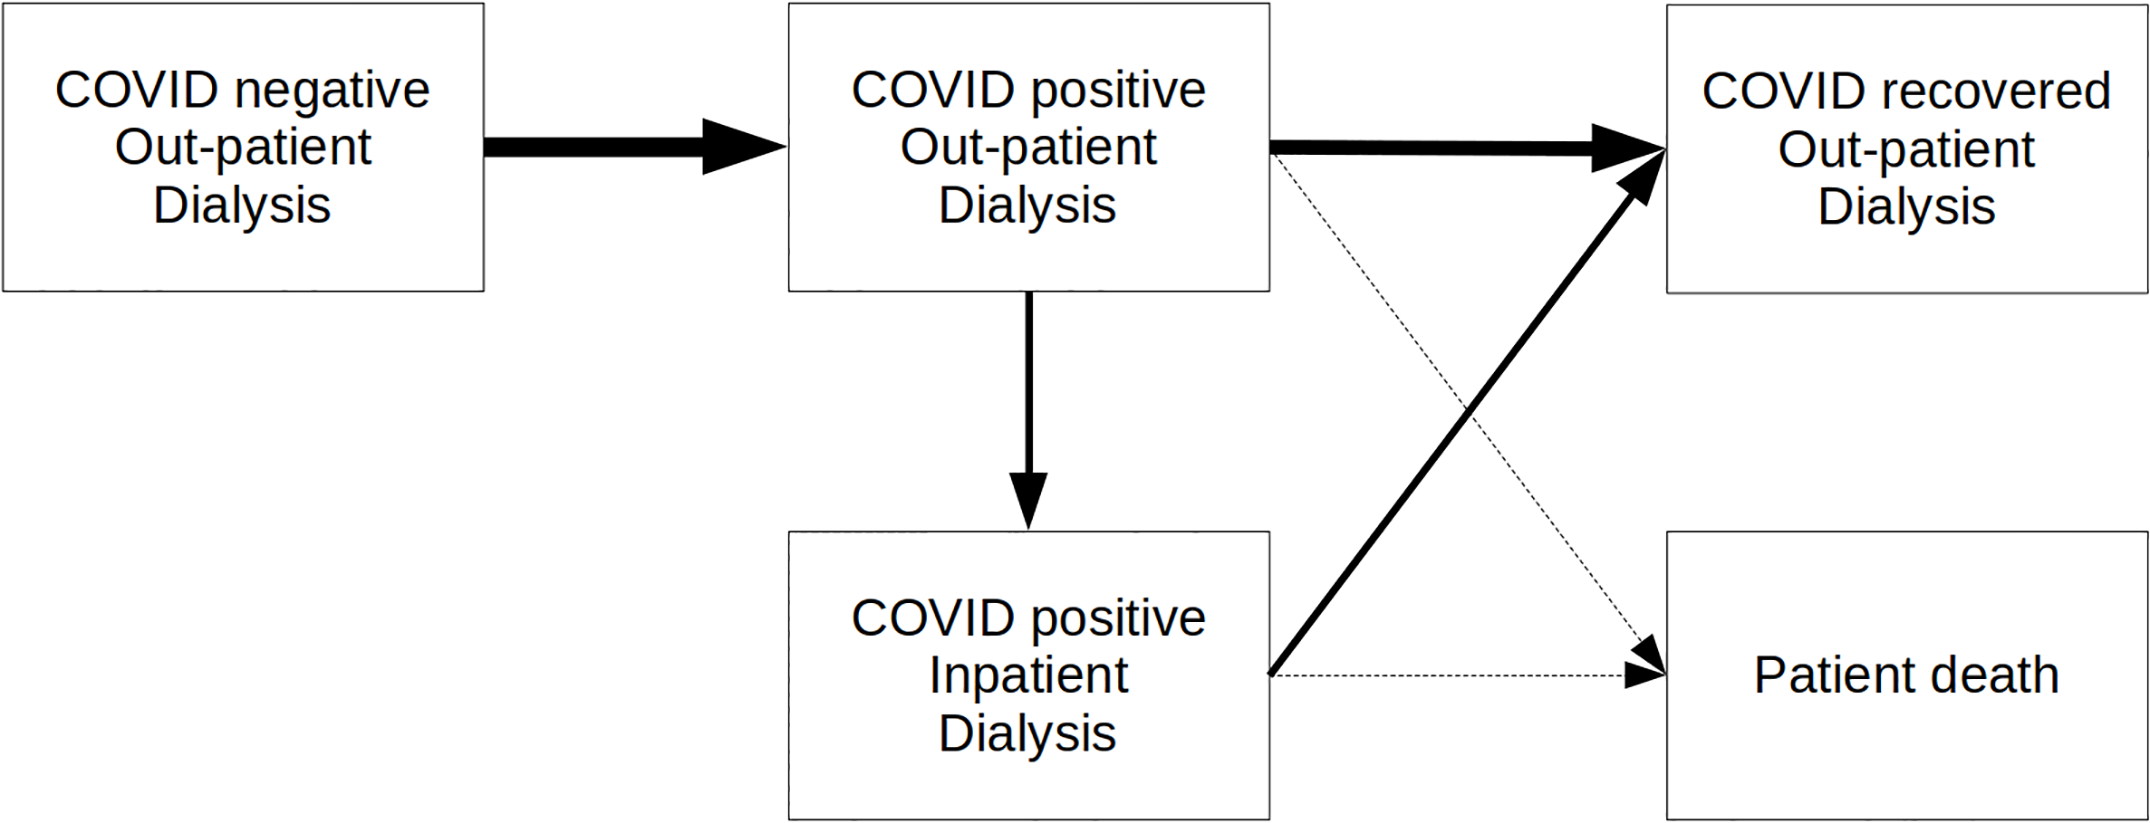
This is a discrete-event simulation modeling patient allocation to dialysis units during the pandemic. The patients need to be transported to a dialysis unit several times a week but, during the pandemic, it was required that COVID positive patients were kept seperate from COVID negative patients. The proposed plan was that all COVID negative units were sent to a particular unit (with a second overflow unit). This study tests that plan with a worst-case scenario of COVID spread over 150 days.
Model patient pathway figure from the original study:
Scope of the reproduction
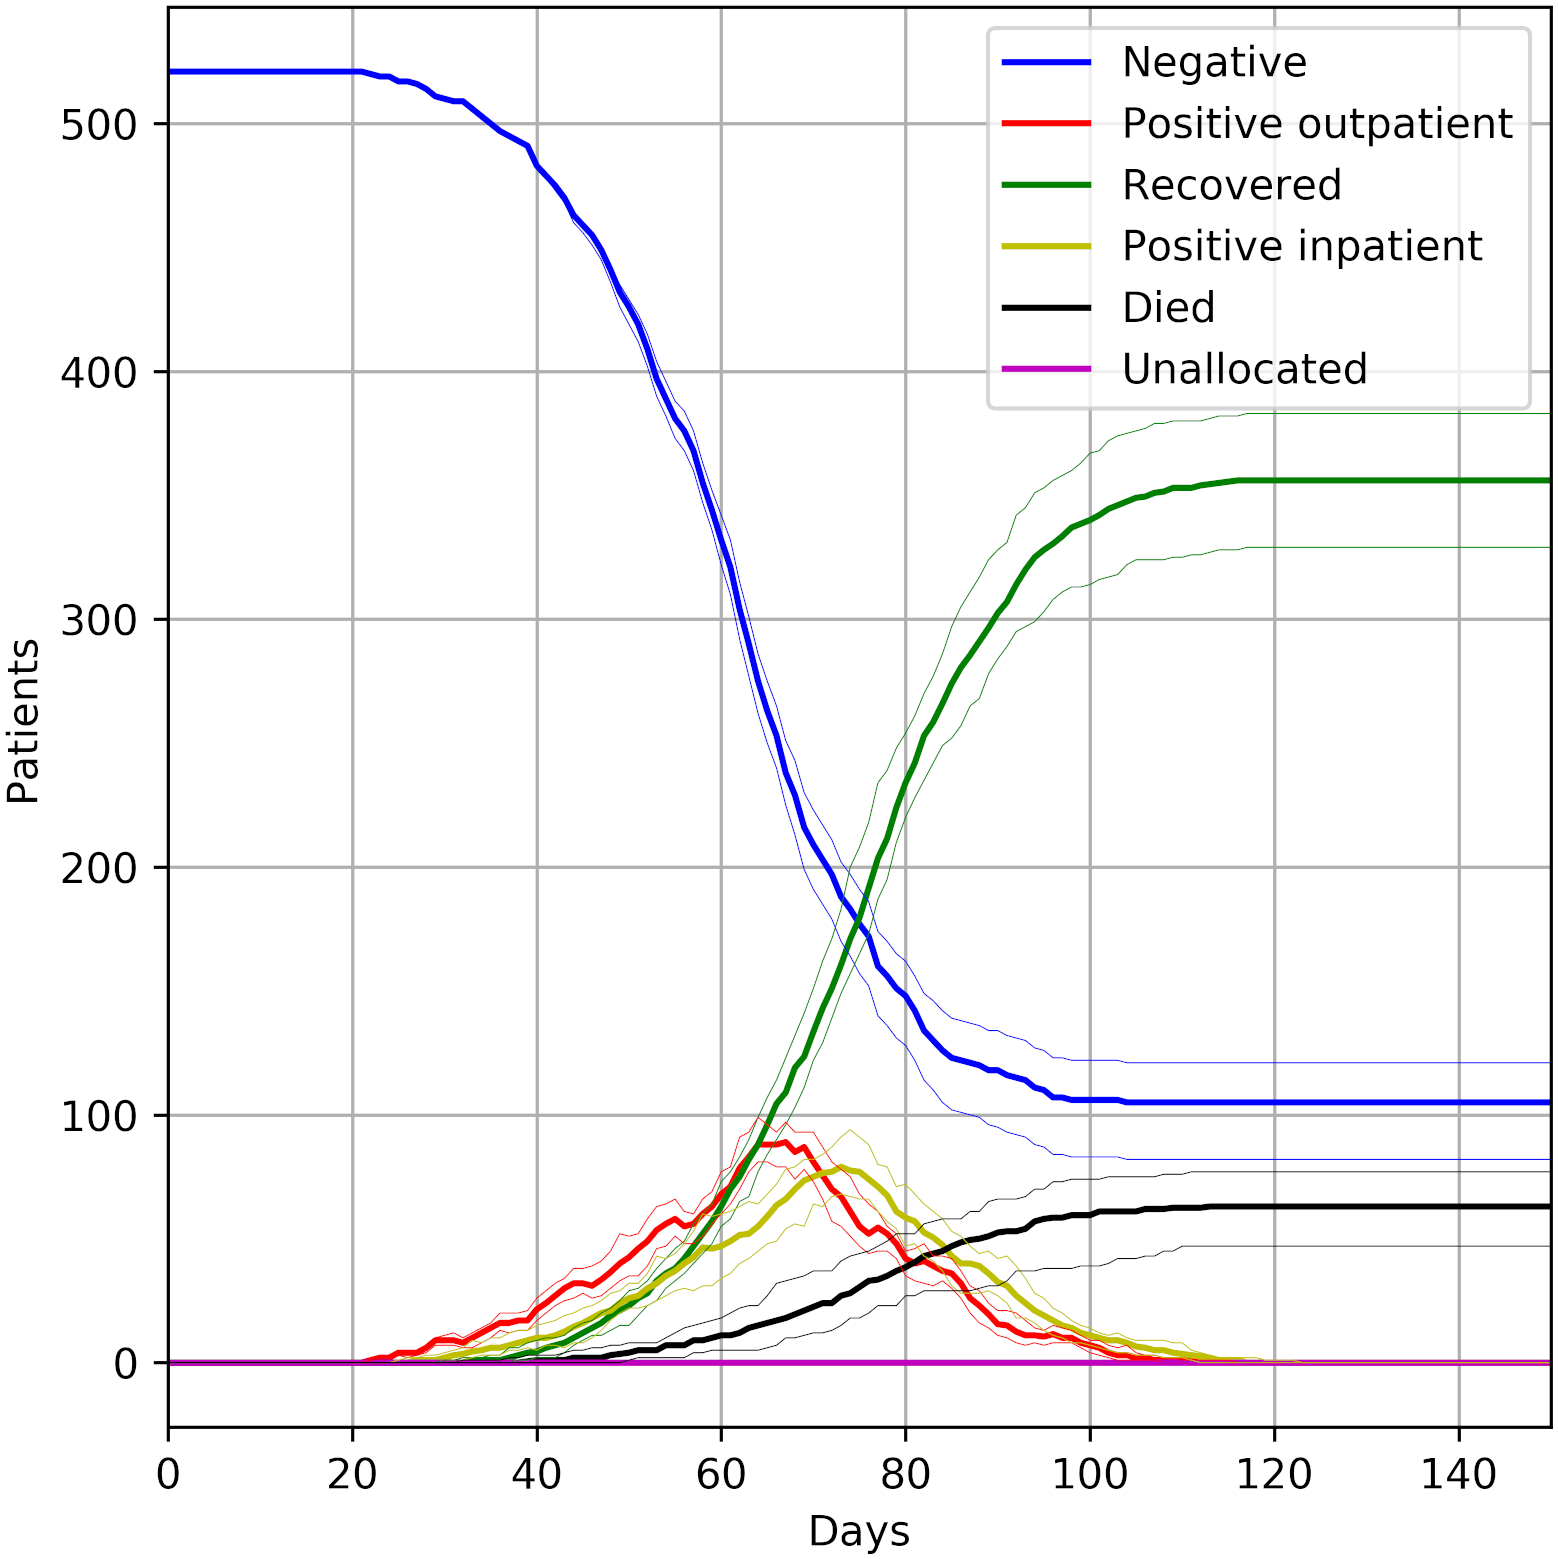
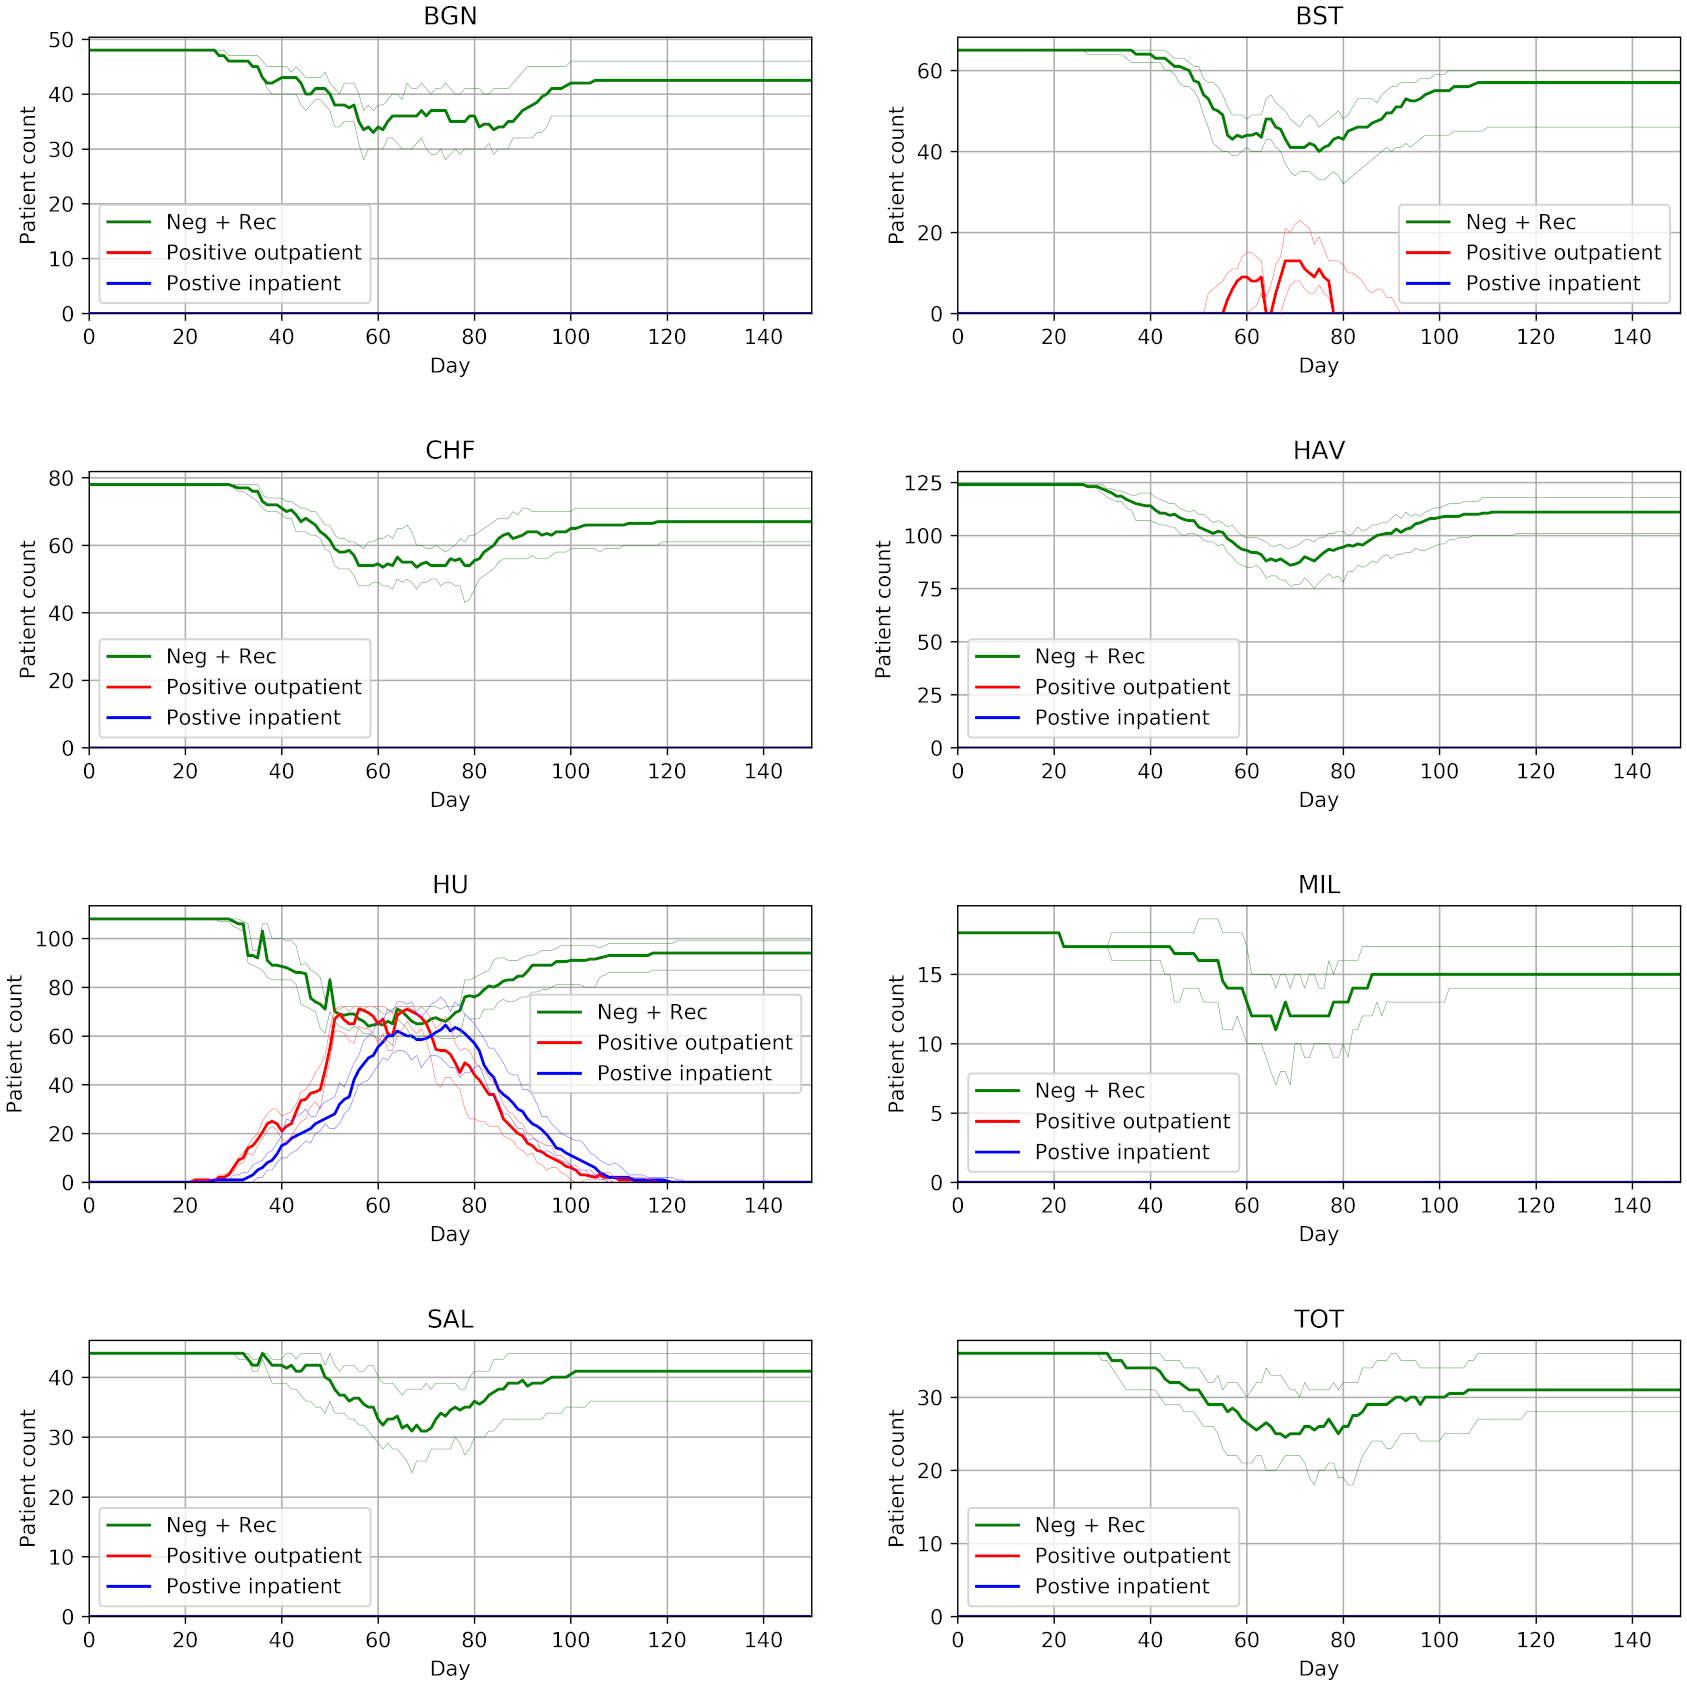
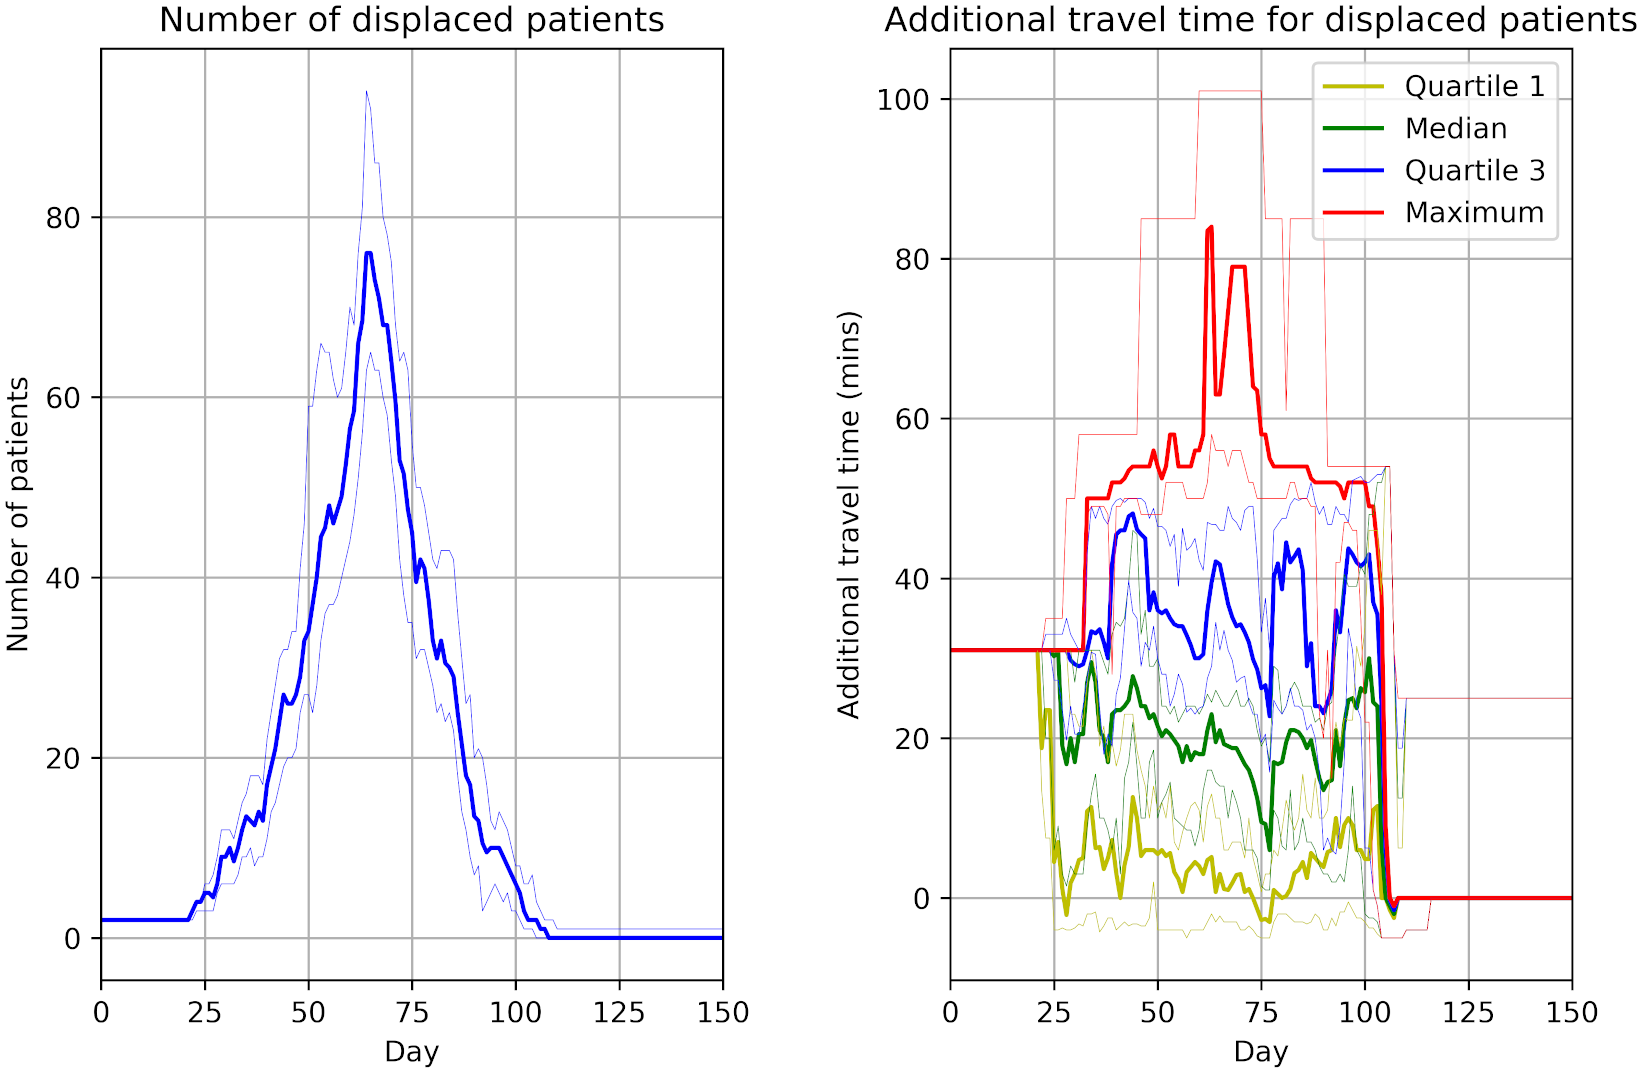
In this assessment, we attempted to reproduced three figures.
Reproducing these results
Repository overview
├── data
│   └──  ...
├── docker
│   └──  ...
├── output
│   └──  ...
├── sim
│   └──  ...
├── tests
│   └──  ...
├── environment.yaml
├── README.md
└── reproduction.ipynbdata/- Data input to the model.docker/- Instructions for creation of Docker container.output/- Output files from the model.sim/- Model code.tests/- Test to check that model produces consistent results with our reproduction.environment.yaml- Instructions for creation of Conda environment.README.md- This file!reproduction.ipynb- Notebook which runs model and reproduces items from scope.
Step 1. Set up environment
You’ll first want create an environment with the specified version of Python and the required packages installed. There are a few options…
Option A: Conda environment
Create the environment using this command in your terminal:
conda env create -f environment.yamlYou can use this environment in your preferred IDE, such as VSCode. To use the browser-based JupyterLab, activate it using
conda activate covid19, and then open JupyterLab by runningjupyter-lab
Option B: Docker
You’ll need
dockerinstalled on your local machine. You can then obtain the image by either:
- Pulling a pre-built image from the GitHub container registry by running
docker pull ghcr.io/pythonhealthdatascience/covid19:latest, or- Building the image locally from the Dockerfile by running
docker build --tag covid19 .To run the image, you should then issue the following commands in your terminal:
docker run -it -p 8080:80 --name covid19_docker covid19conda activate covid19jupyter-labThen open your browser and go to https://localhost:8080. This will open Jupyterlab within the reproduction/ directory.
Step 2. Running the model
To run the model and produce all three items from the scope, execute the notebook reproduction.ipynb.
To check that your results are consistent with our reproduction, run the command pytest in your terminal. When doing so, ensure your current directory is the reproduction/ folder.
Reproduction specs and runtime
This reproduction was conducted on an Intel Core i7-12700H with 32GB RAM running Ubuntu 22.04.4 Linux.
Expected model runtime (given these specs) is 1m 3s (as recorded within the notebook).
Citation
To cite the original study, please refer to the reference above. To cite this reproduction, please refer to the CITATION.cff file in the parent folder.
License
This repository is licensed under the MIT License.