Scope
This page outlines that parts of the journal article which we will attempt to reproduce.
Within scope
Figure 2
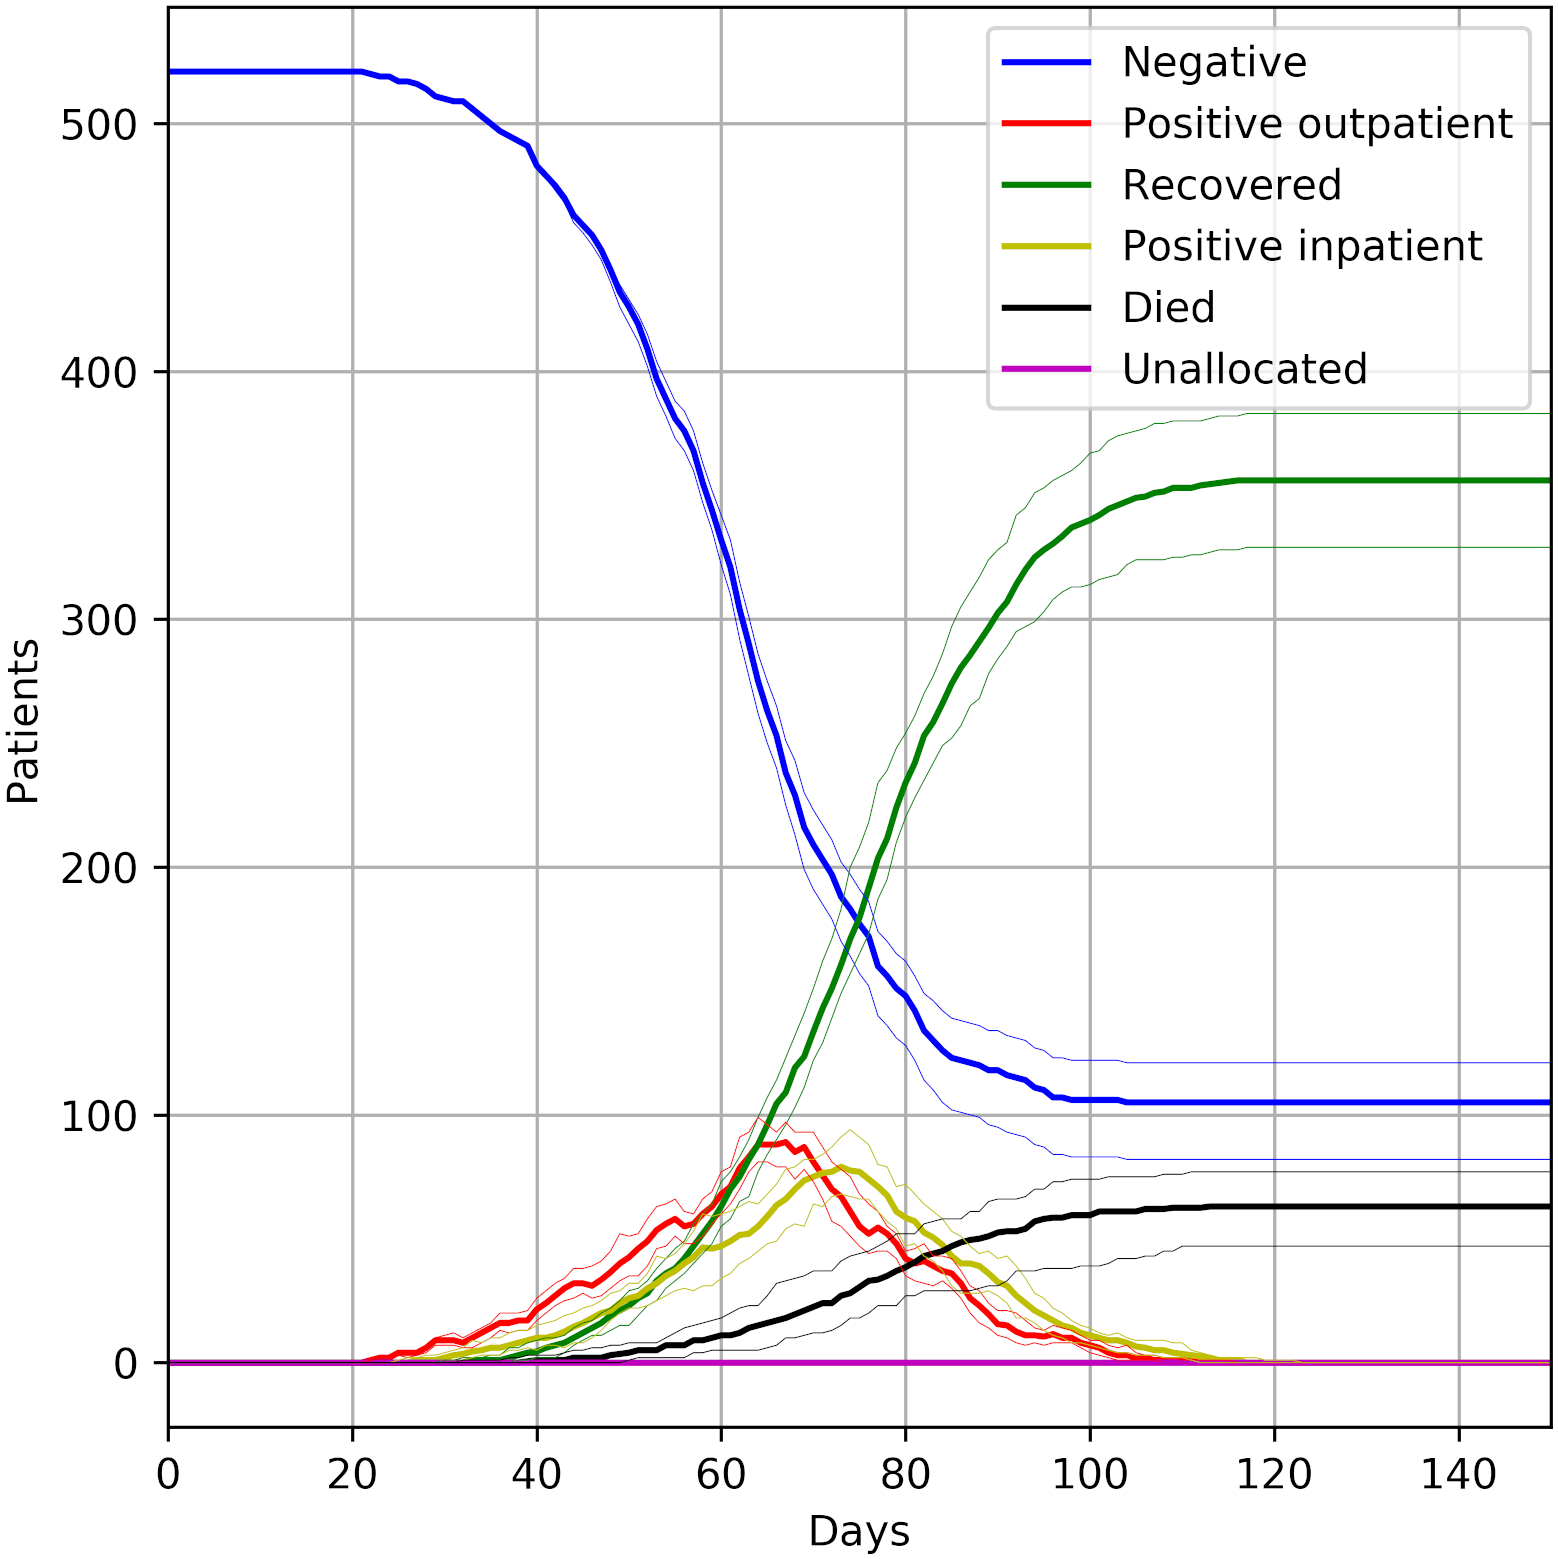
Figure 3
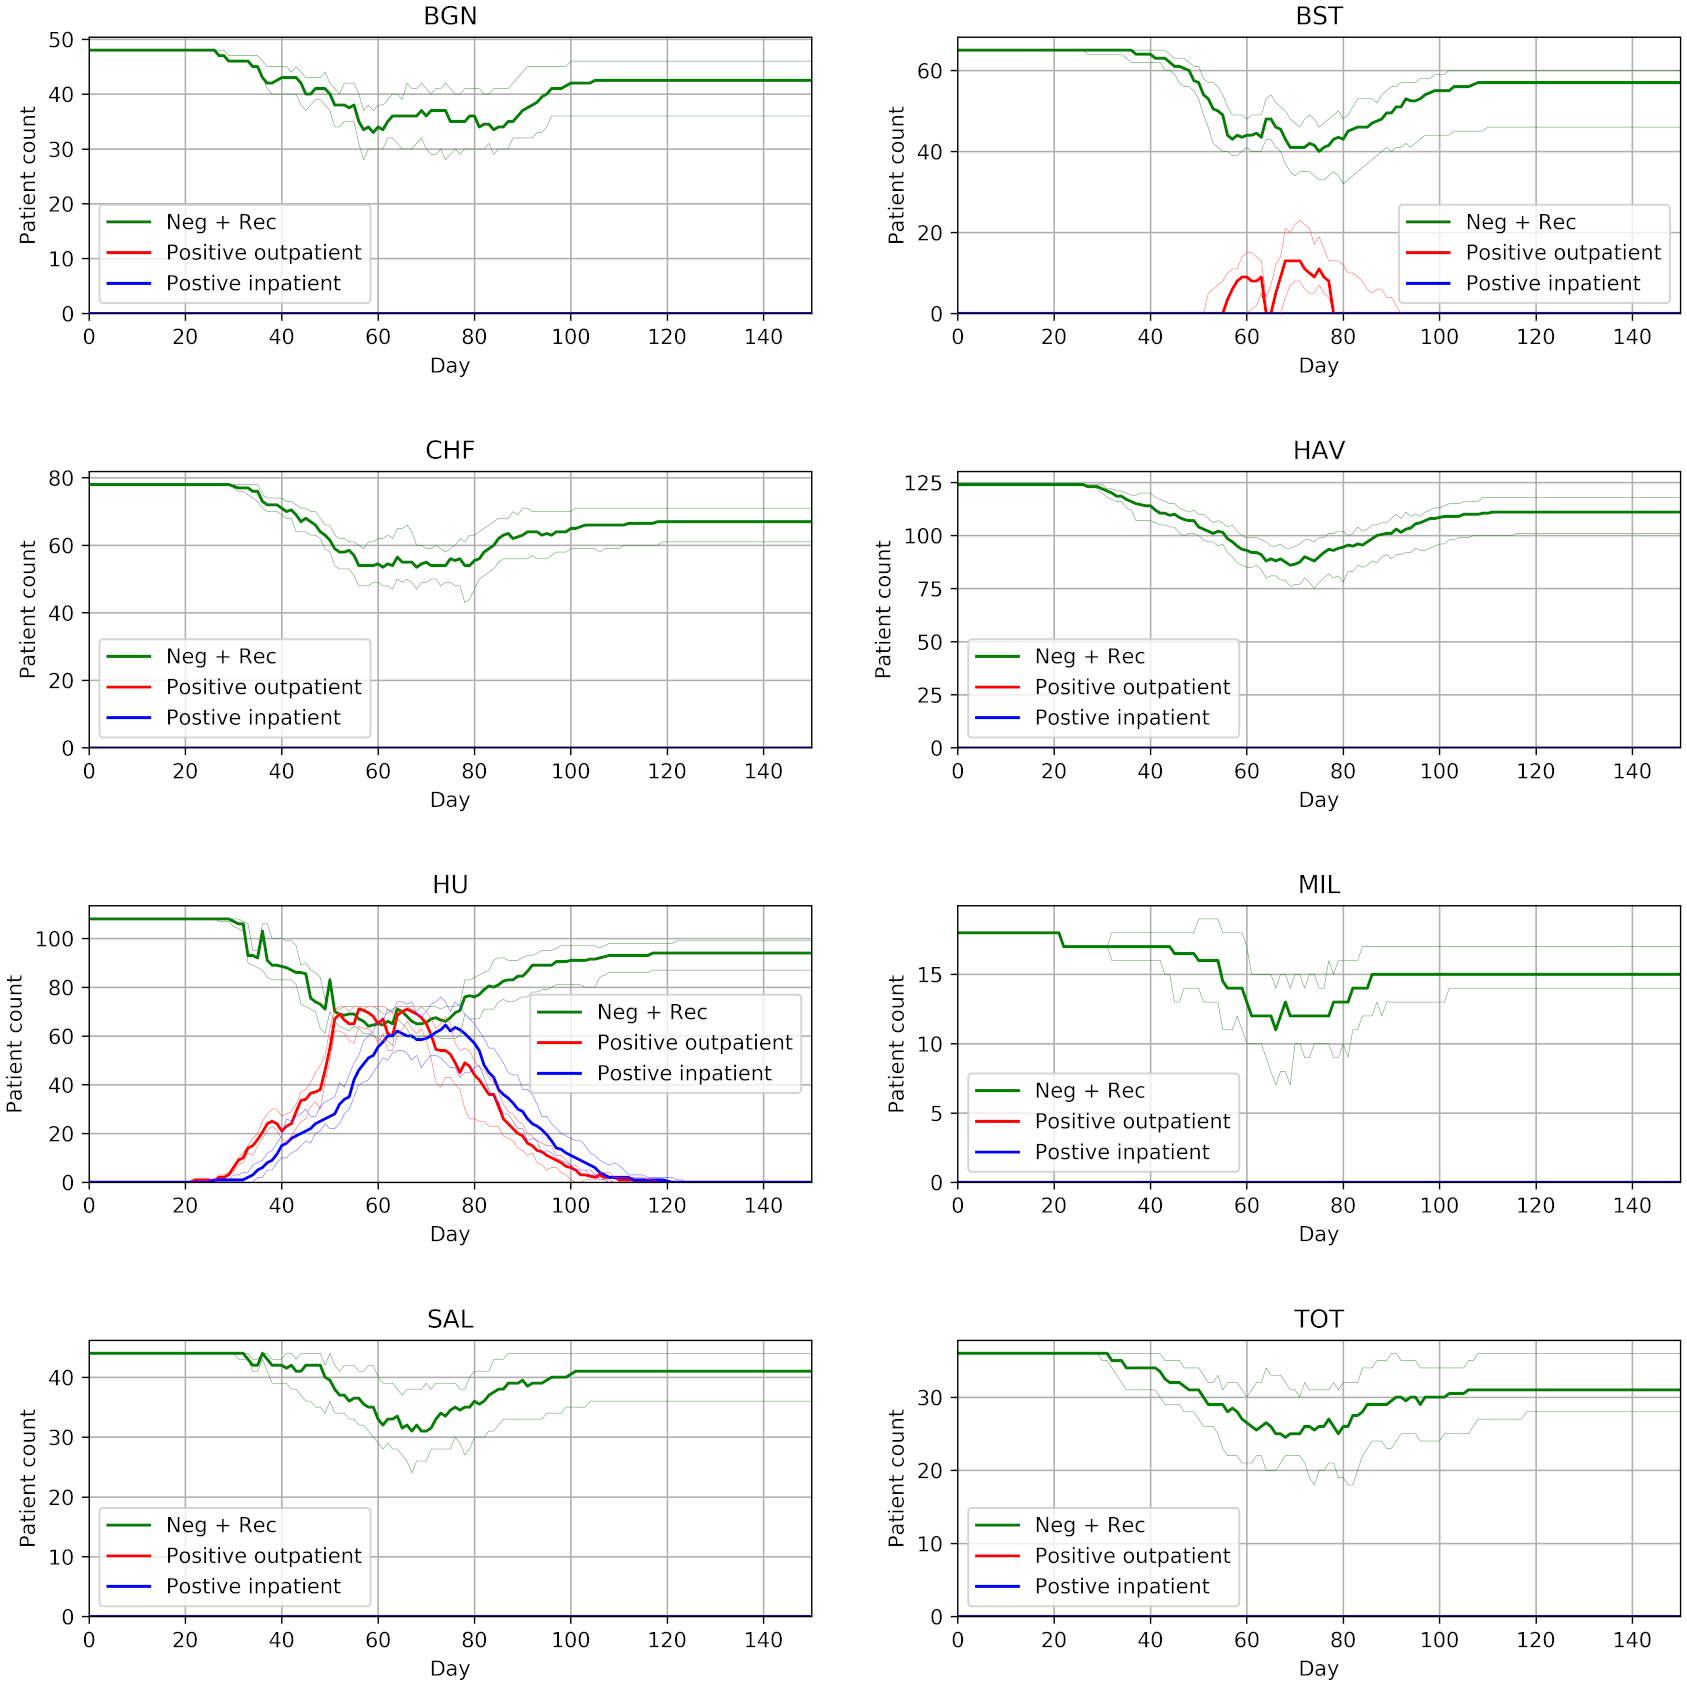
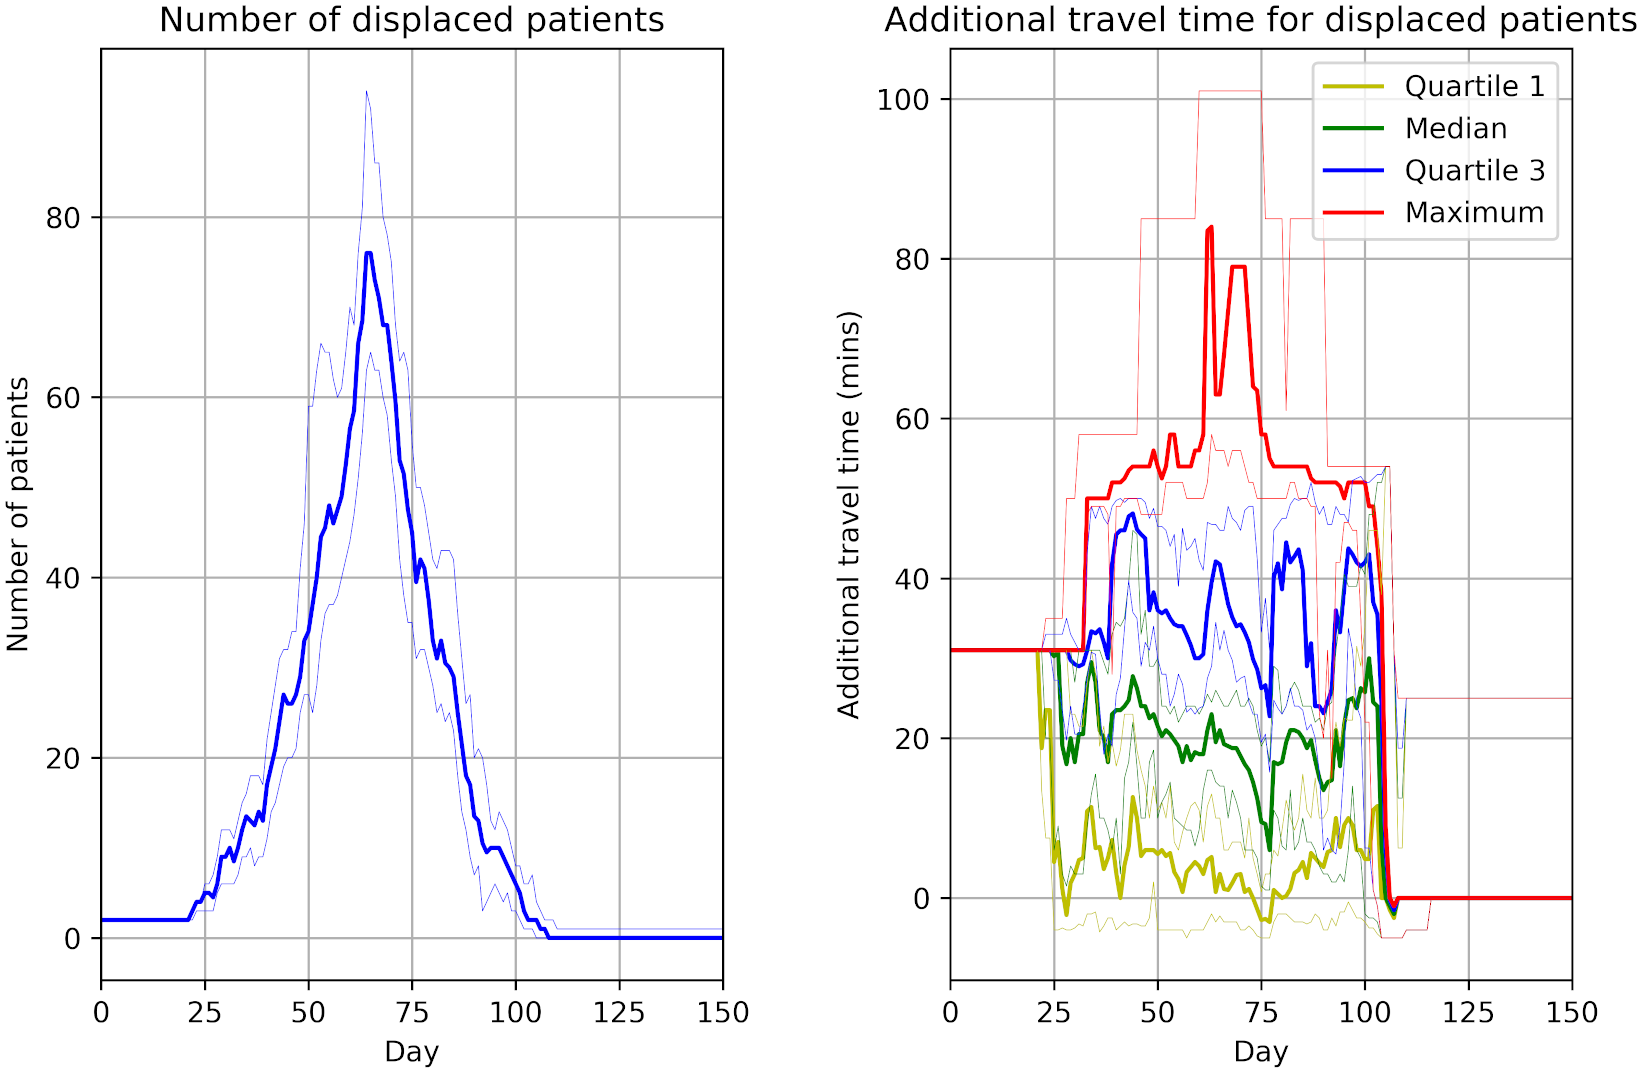
Figure 4
Outside scope
Table 1
Outside scope as it is a table of model parameters rather than outputs.
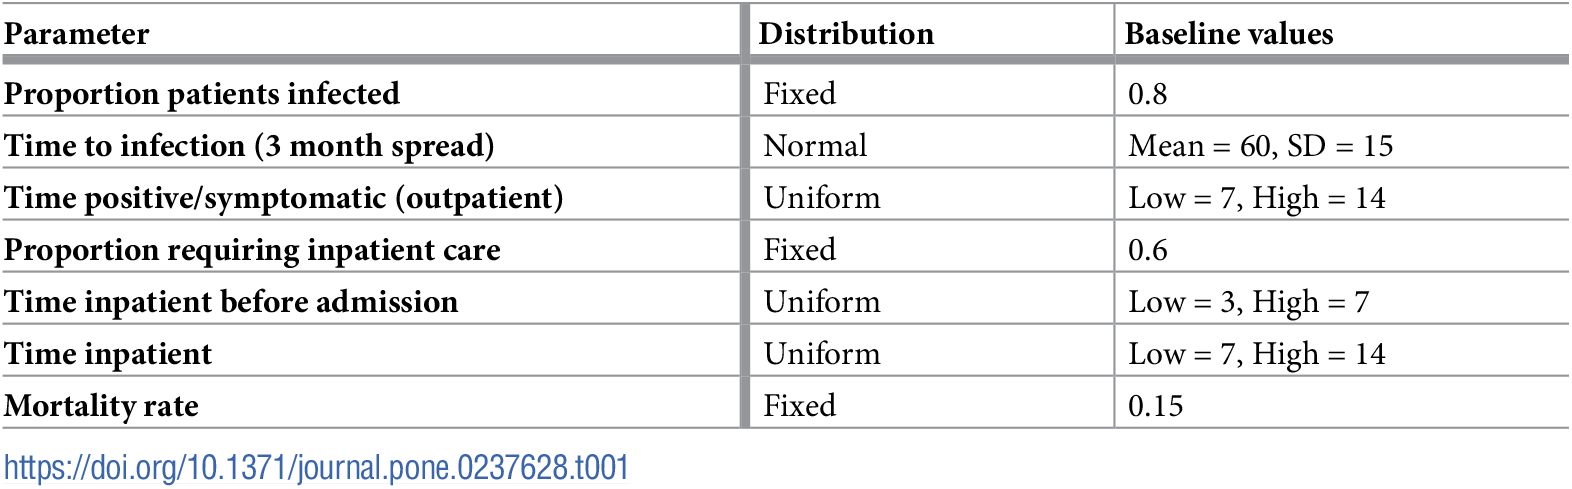
Figure 1
Outside scope as it is a flow chart representing the model pathways.
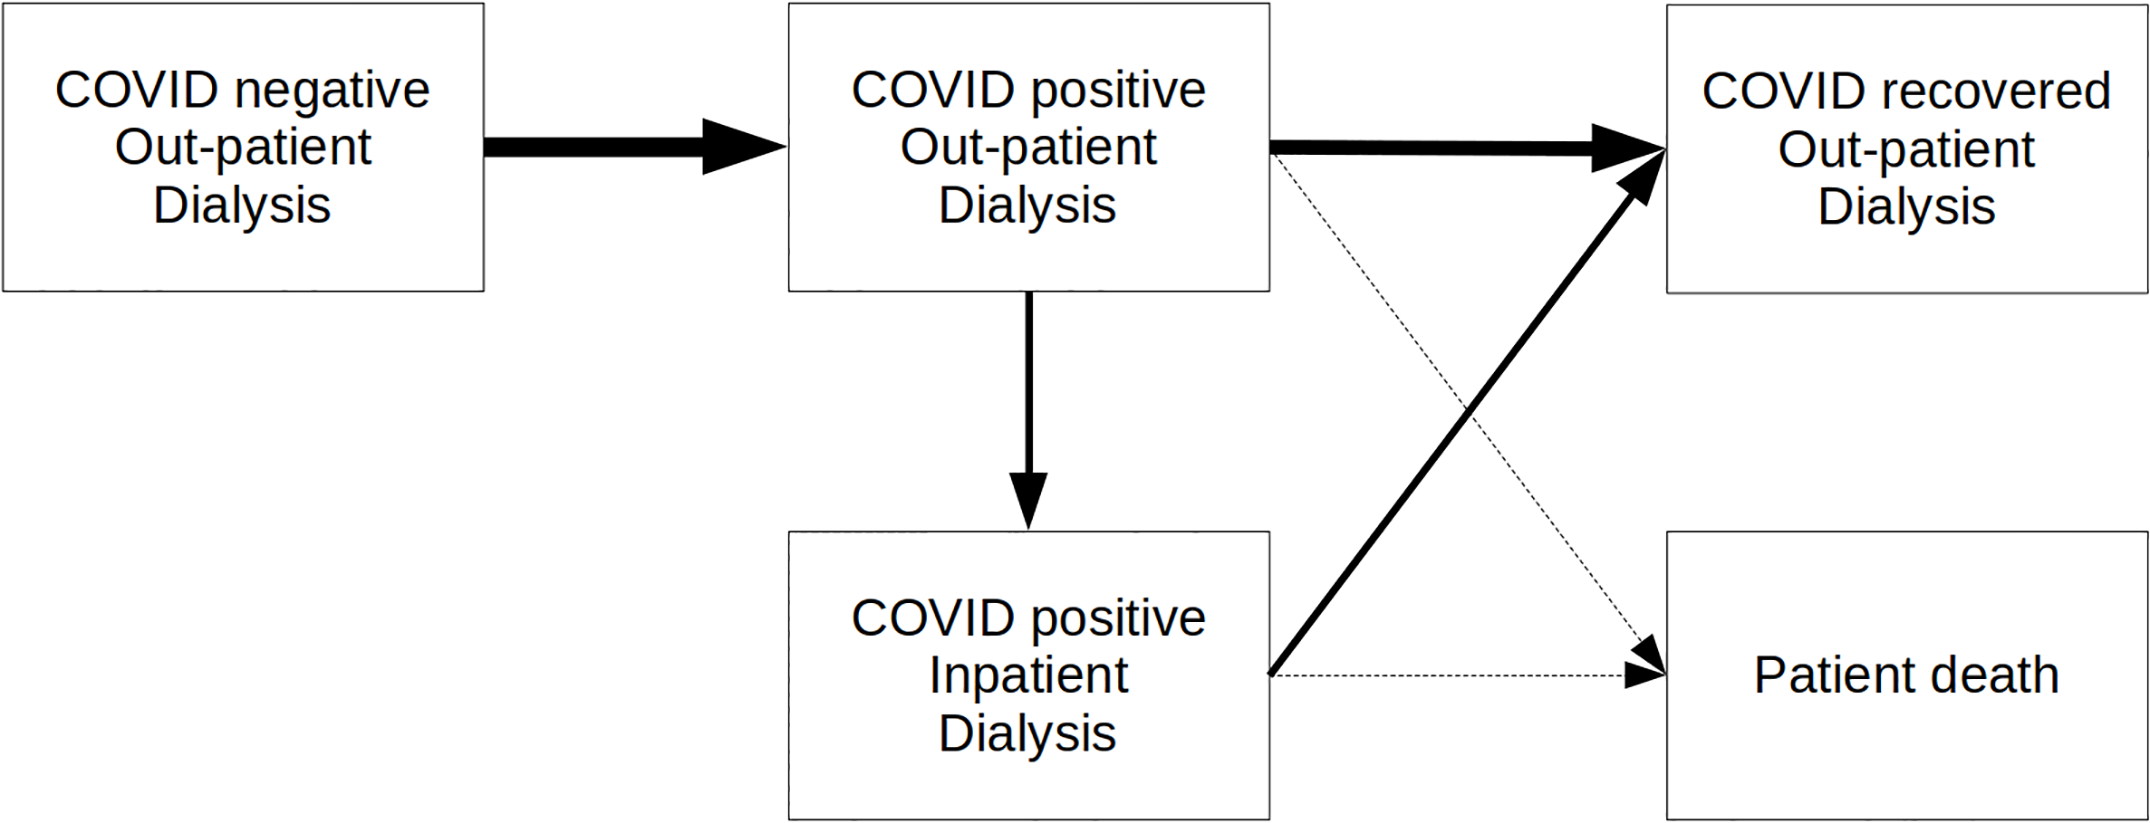
Figure 5
Outside scope as it is a result of the Monte Carlo model.

Figure 6
Outside scope as it is a result of the Monte Carlo model.
References
Allen, Michael, Amir Bhanji, Jonas Willemsen, Steven Dudfield, Stuart Logan, and Thomas Monks. 2020. “A Simulation Modelling Toolkit for Organising Outpatient Dialysis Services During the COVID-19 Pandemic.” PLOS ONE 15 (8): e0237628. https://doi.org/10.1371/journal.pone.0237628.