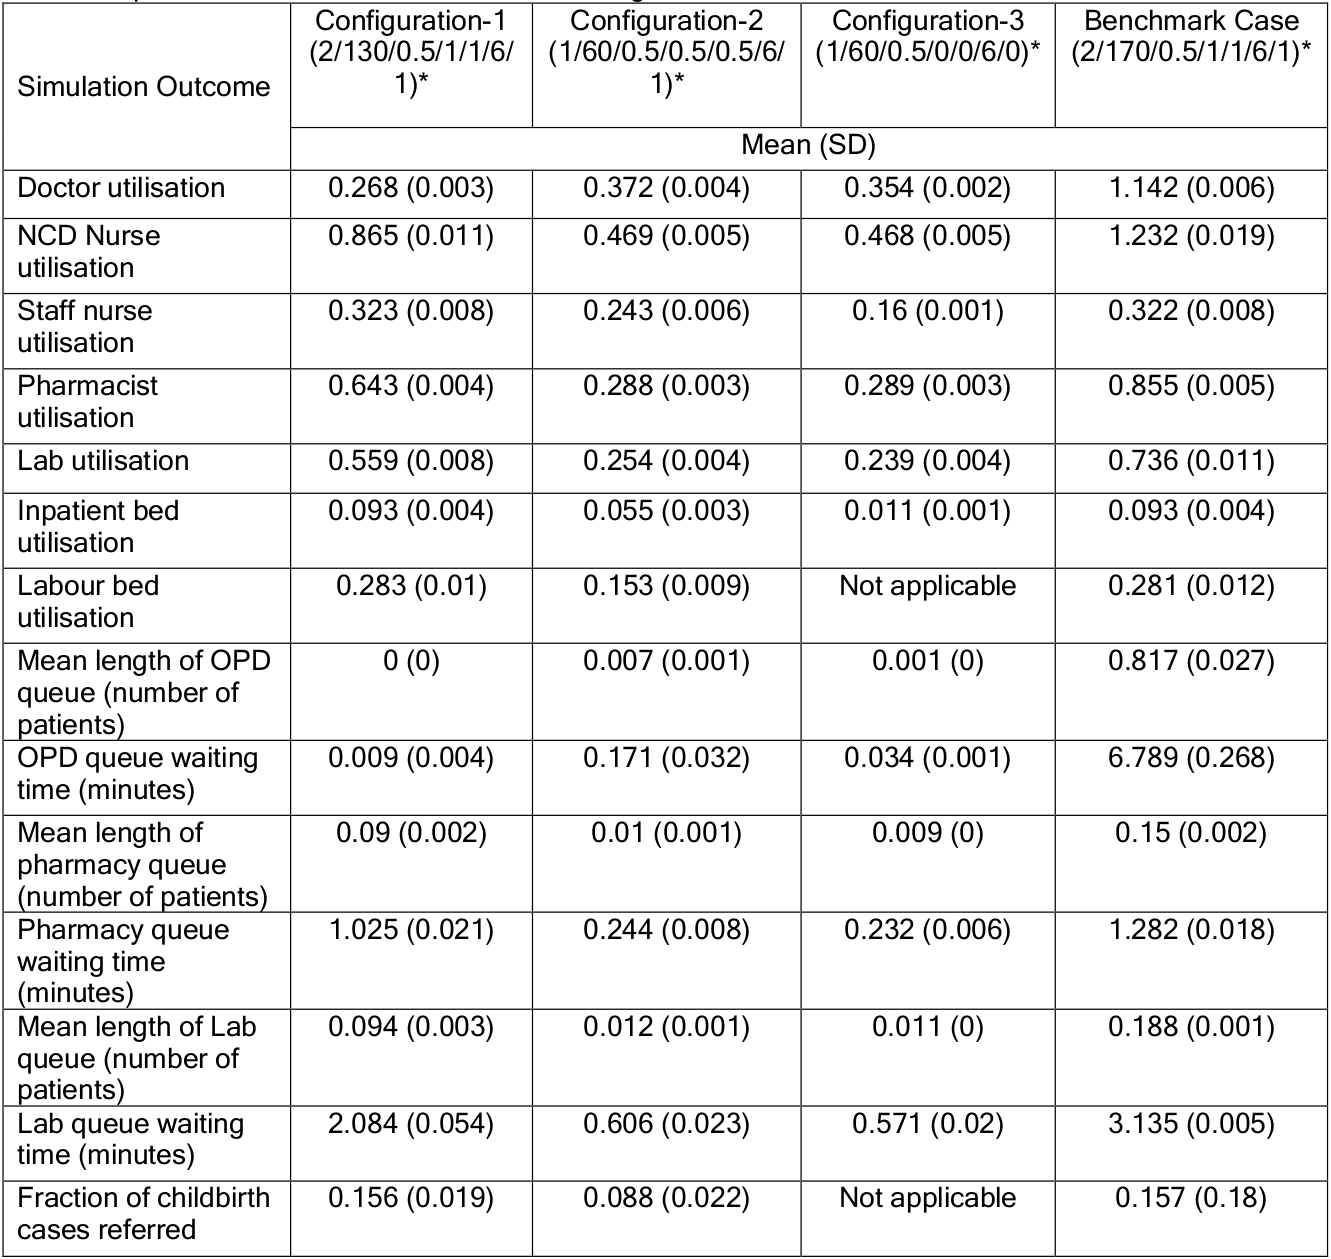
This notebook aims to reproduce Table 6 from Shoaib M, Ramamohan V. Simulation modeling and analysis of primary health center operations. SIMULATION 98(3):183-208. (2022). https://doi.org/10.1177/00375497211030931.
Table 6
Set up
# To run modelimport PHCimport numpy as np# To import and process resultsfrom reproduction_helpers import process_resultsimport pandas as pdimport xlrdimport os# To speed up run timefrom multiprocessing import Pool# Additional package to record runtime of this notebookimport timestart = time.time()
Set parameters for each configuration based on Table 3.
# Have just specified the parameters that changed between configurationst6_c1_param = {'doc_cap': 2,'OPD_iat': 4,'IPD_iat': 2880,'delivery_iat': 1440,'ANC_iat': 1440,'rep_file': 't6_c1.xls'}t6_c2_param = {'doc_cap': 1,'OPD_iat': 9,'IPD_iat': 2880,'delivery_iat': 2880,'ANC_iat': 2880,'rep_file': 't6_c2.xls'}t6_c3_param = {'doc_cap': 1,'OPD_iat': 9,'IPD_iat': 2880,'any_delivery': False,'any_ANC': False,'rep_file': 't6_c3.xls'}t6_c4_param = {'doc_cap': 2,'OPD_iat': 3,'mean': 5,'sd': 1,'consult_boundary_1': 2,'consult_boundary_2': 2,'IPD_iat': 2880,'delivery_iat': 1440,'ANC_iat': 1440,'rep_file': 't6_c4.xls'}
# Create list of parameter dictionariesconfig = [t6_c1_param, t6_c2_param, t6_c3_param, t6_c4_param]# Append 's_' to all itemsfor i, d inenumerate(config): config[i] = {f's_{k}': v for k, v in d.items()}
Run model for each configuration using parallel processing.
# Wrapper function to allow input of dictionary with pooldef wrapper(d):return PHC.main(**d)# Create a process pool that uses all CPUswith Pool(4) as pool:# Run PHC.main() using each of inputs from config pool.map(wrapper, config)
 No of replications done 0
 No of replications done 0
 No of replications done 1
 No of replications done 1
 No of replications done 0
 No of replications done 2
 No of replications done 0
 No of replications done 2
 No of replications done 3
 No of replications done 3
 No of replications done 1
 No of replications done 4
 No of replications done 4
 No of replications done 5
 No of replications done 1
 No of replications done 5
 No of replications done 6
 No of replications done 2
 No of replications done 6
 No of replications done 7
 No of replications done 7
 No of replications done 8
 No of replications done 2
 No of replications done 3
 No of replications done 9
 No of replications done 8
 No of replications done 9
 No of replications done 4
 No of replications done 3
 No of replications done 5
 No of replications done 4
 No of replications done 6
 No of replications done 5
 No of replications done 7
 No of replications done 8
 No of replications done 6
 No of replications done 9
 No of replications done 7
 No of replications done 8
 No of replications done 9
Import and process replication results
# Make dictionary with labels from table 6, and corresponding names from model outputt6_labels = {'doc occ': 'Doctor utilisation','NCD occ': 'NCD Nurse utilisation','staff nurse occ': 'Staff nurse utilisation','pharm occ': 'Pharmacist utilisation','lab occ': 'Lab utilisation','ipd bed occ': 'Inpatient bed utilisation','del occ': 'Labour bed utilisation', # "Del" stands for delivery'opd q len': 'Mean length of OPD queue (number of patients)','OPD Q wt': 'OPD queue waiting time (minutes)','pharmacy q len': 'Mean length of pharmacy queue (number of patients)','Pharmacy Q wt': 'Pharmacy queue waiting time (minutes)','lab q len': 'Mean length of Lab queue (number of patients)','Lab Q wt': 'Lab queue waiting time (minutes)','prop_del_referred': 'Fraction of childbirth cases referred'}
# Get results from those filesfiles = ['t6_c1', 't6_c2', 't6_c3', 't6_c4']summary = process_results(files, sd=True).reset_index().rename( columns= {'index': 'model_outcome'})# Add labels to model resultssummary['t6_outcome'] = summary['model_outcome'].map(t6_labels)summary
model_outcome
model_t6_c1_mean
model_t6_c1_sd
model_t6_c2_mean
model_t6_c2_sd
model_t6_c3_mean
model_t6_c3_sd
model_t6_c4_mean
model_t6_c4_sd
t6_outcome
0
OPD patients
33101.900000
187.146081
14859.700000
143.959910
14850.100000
109.377481
43965.100000
194.210338
NaN
1
IPD patients
184.800000
15.795921
184.400000
11.918240
185.900000
7.460265
178.600000
9.359487
NaN
2
ANC patients
359.300000
13.888844
210.000000
11.015141
0.000000
0.000000
360.900000
14.487159
NaN
3
Del patients
353.800000
15.368077
189.100000
11.948501
NaN
NaN
373.300000
21.689987
NaN
4
OPD Q wt
0.008353
0.003899
0.178456
0.032152
0.035088
0.001552
6.936889
0.317485
OPD queue waiting time (minutes)
5
Pharmacy Q wt
1.028137
0.030612
0.243665
0.004954
0.230186
0.005995
1.282328
0.019748
Pharmacy queue waiting time (minutes)
6
Lab Q wt
2.093213
0.044016
0.597352
0.015955
0.560986
0.023920
3.123766
0.082075
Lab queue waiting time (minutes)
7
doc occ
0.268659
0.001616
0.371607
0.004346
0.353566
0.001425
1.141365
0.005321
Doctor utilisation
8
Lab patient list
188885.800000
104210.318073
85433.500000
47183.868802
85595.300000
46948.304603
250794.800000
138149.363001
NaN
9
OPD q len
0.006918
0.003500
0.179808
0.042491
0.034079
0.001502
6.851667
0.332248
NaN
10
ipd occ
0.096000
0.005164
0.061000
0.003162
0.012000
0.004216
0.098000
0.004216
NaN
11
opd q len
0.000736
0.000342
0.007070
0.001264
0.001387
0.000066
0.812750
0.040379
Mean length of OPD queue (number of patients)
12
pharmacy q len
0.090371
0.002949
0.009623
0.000204
0.009097
0.000242
0.149890
0.002749
Mean length of pharmacy queue (number of patie...
13
lab q len
0.094789
0.002610
0.012369
0.000372
0.011094
0.000492
0.185814
0.005814
Mean length of Lab queue (number of patients)
14
NCD occ
0.868296
0.009839
0.466542
0.004252
0.467458
0.003913
1.230139
0.014734
NCD Nurse utilisation
15
lab occ
0.554516
0.006856
0.253693
0.003409
0.238568
0.004396
0.728652
0.014631
Lab utilisation
16
pharm occ
0.642648
0.003439
0.288656
0.002787
0.288370
0.002555
0.853658
0.004257
Pharmacist utilisation
17
staff nurse occ
0.318275
0.006835
0.246430
0.005604
0.160976
0.000811
0.325778
0.009066
Staff nurse utilisation
18
del occ
0.280000
0.014142
0.157000
0.006749
NaN
NaN
0.285000
0.012693
Labour bed utilisation
19
del referred
52.300000
5.869885
17.500000
2.223611
NaN
NaN
62.200000
9.259230
NaN
20
ipd bed occ
0.091780
0.003905
0.057443
0.003663
0.011905
0.000581
0.093865
0.004500
Inpatient bed utilisation
21
prop_del_referred
0.147775
0.014515
0.092491
0.009510
NaN
NaN
0.166276
0.019396
Fraction of childbirth cases referred
Import table 6 results and compare against run results
# Round to 3dp (as in table) and mergecompare = t6.merge(round(summary,3))compare.head()
t6_outcome
config1_mean
config1_sd
config2_mean
config2_sd
config3_mean
config3_sd
benchmark_mean
benchmark_sd
model_outcome
model_t6_c1_mean
model_t6_c1_sd
model_t6_c2_mean
model_t6_c2_sd
model_t6_c3_mean
model_t6_c3_sd
model_t6_c4_mean
model_t6_c4_sd
0
Doctor utilisation
0.268
0.003
0.372
0.004
0.354
0.002
1.142
0.006
doc occ
0.269
0.002
0.372
0.004
0.354
0.001
1.141
0.005
1
NCD Nurse utilisation
0.865
0.011
0.469
0.005
0.468
0.005
1.232
0.019
NCD occ
0.868
0.010
0.467
0.004
0.467
0.004
1.230
0.015
2
Staff nurse utilisation
0.323
0.008
0.243
0.006
0.160
0.001
0.322
0.008
staff nurse occ
0.318
0.007
0.246
0.006
0.161
0.001
0.326
0.009
3
Pharmacist utilisation
0.643
0.004
0.288
0.003
0.289
0.003
0.855
0.005
pharm occ
0.643
0.003
0.289
0.003
0.288
0.003
0.854
0.004
4
Lab utilisation
0.559
0.008
0.254
0.004
0.239
0.004
0.736
0.011
lab occ
0.555
0.007
0.254
0.003
0.239
0.004
0.729
0.015
compare_col = [ ('config1_mean', 'model_t6_c1_mean'), ('config1_sd', 'model_t6_c1_sd'), ('config2_mean', 'model_t6_c2_mean'), ('config2_sd', 'model_t6_c2_sd'), ('config3_mean', 'model_t6_c3_mean'), ('config3_sd', 'model_t6_c3_sd'), ('benchmark_mean', 'model_t6_c4_mean'), ('benchmark_sd', 'model_t6_c4_sd'),]for col in compare_col:# Find difference between two columns compare[f'change_{col[1]}'] =abs(compare[col[1]] - compare[col[0]])# Find percent change between two columns subset = compare[list(col)] pct_change = subset.pct_change(axis=1).iloc[:, 1]*100 compare[f'pct_change_{col[1]}'] = pct_change# Display each of the resultsfor col in compare_col:# Set outcome as index, and get the two results plus percent change subset = compare.set_index('t6_outcome')[list(col) + [f'change_{col[1]}', f'pct_change_{col[1]}']] display(subset)
config1_mean
model_t6_c1_mean
change_model_t6_c1_mean
pct_change_model_t6_c1_mean
t6_outcome
Doctor utilisation
0.268
0.269
0.001
0.373134
NCD Nurse utilisation
0.865
0.868
0.003
0.346821
Staff nurse utilisation
0.323
0.318
0.005
-1.547988
Pharmacist utilisation
0.643
0.643
0.000
0.000000
Lab utilisation
0.559
0.555
0.004
-0.715564
Inpatient bed utilisation
0.093
0.092
0.001
-1.075269
Labour bed utilisation
0.283
0.280
0.003
-1.060071
Mean length of OPD queue (number of patients)
0.000
0.001
0.001
inf
OPD queue waiting time (minutes)
0.009
0.008
0.001
-11.111111
Mean length of pharmacy queue (number of patients)
0.090
0.090
0.000
0.000000
Pharmacy queue waiting time (minutes)
1.025
1.028
0.003
0.292683
Mean length of Lab queue (number of patients)
0.094
0.095
0.001
1.063830
Lab queue waiting time (minutes)
2.084
2.093
0.009
0.431862
Fraction of childbirth cases referred
0.156
0.148
0.008
-5.128205
config1_sd
model_t6_c1_sd
change_model_t6_c1_sd
pct_change_model_t6_c1_sd
t6_outcome
Doctor utilisation
0.003
0.002
0.001
-33.333333
NCD Nurse utilisation
0.011
0.010
0.001
-9.090909
Staff nurse utilisation
0.008
0.007
0.001
-12.500000
Pharmacist utilisation
0.004
0.003
0.001
-25.000000
Lab utilisation
0.008
0.007
0.001
-12.500000
Inpatient bed utilisation
0.004
0.004
0.000
0.000000
Labour bed utilisation
0.010
0.014
0.004
40.000000
Mean length of OPD queue (number of patients)
0.000
0.000
0.000
NaN
OPD queue waiting time (minutes)
0.004
0.004
0.000
0.000000
Mean length of pharmacy queue (number of patients)
0.002
0.003
0.001
50.000000
Pharmacy queue waiting time (minutes)
0.021
0.031
0.010
47.619048
Mean length of Lab queue (number of patients)
0.003
0.003
0.000
0.000000
Lab queue waiting time (minutes)
0.054
0.044
0.010
-18.518519
Fraction of childbirth cases referred
0.019
0.015
0.004
-21.052632
config2_mean
model_t6_c2_mean
change_model_t6_c2_mean
pct_change_model_t6_c2_mean
t6_outcome
Doctor utilisation
0.372
0.372
0.000
0.000000
NCD Nurse utilisation
0.469
0.467
0.002
-0.426439
Staff nurse utilisation
0.243
0.246
0.003
1.234568
Pharmacist utilisation
0.288
0.289
0.001
0.347222
Lab utilisation
0.254
0.254
0.000
0.000000
Inpatient bed utilisation
0.055
0.057
0.002
3.636364
Labour bed utilisation
0.153
0.157
0.004
2.614379
Mean length of OPD queue (number of patients)
0.007
0.007
0.000
0.000000
OPD queue waiting time (minutes)
0.171
0.178
0.007
4.093567
Mean length of pharmacy queue (number of patients)
0.010
0.010
0.000
0.000000
Pharmacy queue waiting time (minutes)
0.244
0.244
0.000
0.000000
Mean length of Lab queue (number of patients)
0.012
0.012
0.000
0.000000
Lab queue waiting time (minutes)
0.606
0.597
0.009
-1.485149
Fraction of childbirth cases referred
0.088
0.092
0.004
4.545455
config2_sd
model_t6_c2_sd
change_model_t6_c2_sd
pct_change_model_t6_c2_sd
t6_outcome
Doctor utilisation
0.004
0.004
0.000
0.000000
NCD Nurse utilisation
0.005
0.004
0.001
-20.000000
Staff nurse utilisation
0.006
0.006
0.000
0.000000
Pharmacist utilisation
0.003
0.003
0.000
0.000000
Lab utilisation
0.004
0.003
0.001
-25.000000
Inpatient bed utilisation
0.003
0.004
0.001
33.333333
Labour bed utilisation
0.009
0.007
0.002
-22.222222
Mean length of OPD queue (number of patients)
0.001
0.001
0.000
0.000000
OPD queue waiting time (minutes)
0.032
0.032
0.000
0.000000
Mean length of pharmacy queue (number of patients)
0.001
0.000
0.001
-100.000000
Pharmacy queue waiting time (minutes)
0.008
0.005
0.003
-37.500000
Mean length of Lab queue (number of patients)
0.001
0.000
0.001
-100.000000
Lab queue waiting time (minutes)
0.023
0.016
0.007
-30.434783
Fraction of childbirth cases referred
0.022
0.010
0.012
-54.545455
config3_mean
model_t6_c3_mean
change_model_t6_c3_mean
pct_change_model_t6_c3_mean
t6_outcome
Doctor utilisation
0.354
0.354
0.000
0.000000
NCD Nurse utilisation
0.468
0.467
0.001
-0.213675
Staff nurse utilisation
0.160
0.161
0.001
0.625000
Pharmacist utilisation
0.289
0.288
0.001
-0.346021
Lab utilisation
0.239
0.239
0.000
0.000000
Inpatient bed utilisation
0.011
0.012
0.001
9.090909
Labour bed utilisation
NaN
NaN
NaN
NaN
Mean length of OPD queue (number of patients)
0.001
0.001
0.000
0.000000
OPD queue waiting time (minutes)
0.034
0.035
0.001
2.941176
Mean length of pharmacy queue (number of patients)
0.009
0.009
0.000
0.000000
Pharmacy queue waiting time (minutes)
0.232
0.230
0.002
-0.862069
Mean length of Lab queue (number of patients)
0.011
0.011
0.000
0.000000
Lab queue waiting time (minutes)
0.571
0.561
0.010
-1.751313
Fraction of childbirth cases referred
NaN
NaN
NaN
NaN
config3_sd
model_t6_c3_sd
change_model_t6_c3_sd
pct_change_model_t6_c3_sd
t6_outcome
Doctor utilisation
0.002
0.001
0.001
-50.0
NCD Nurse utilisation
0.005
0.004
0.001
-20.0
Staff nurse utilisation
0.001
0.001
0.000
0.0
Pharmacist utilisation
0.003
0.003
0.000
0.0
Lab utilisation
0.004
0.004
0.000
0.0
Inpatient bed utilisation
0.001
0.001
0.000
0.0
Labour bed utilisation
NaN
NaN
NaN
NaN
Mean length of OPD queue (number of patients)
0.000
0.000
0.000
NaN
OPD queue waiting time (minutes)
0.001
0.002
0.001
100.0
Mean length of pharmacy queue (number of patients)
0.000
0.000
0.000
NaN
Pharmacy queue waiting time (minutes)
0.006
0.006
0.000
0.0
Mean length of Lab queue (number of patients)
0.000
0.000
0.000
NaN
Lab queue waiting time (minutes)
0.020
0.024
0.004
20.0
Fraction of childbirth cases referred
NaN
NaN
NaN
NaN
benchmark_mean
model_t6_c4_mean
change_model_t6_c4_mean
pct_change_model_t6_c4_mean
t6_outcome
Doctor utilisation
1.142
1.141
0.001
-0.087566
NCD Nurse utilisation
1.232
1.230
0.002
-0.162338
Staff nurse utilisation
0.322
0.326
0.004
1.242236
Pharmacist utilisation
0.855
0.854
0.001
-0.116959
Lab utilisation
0.736
0.729
0.007
-0.951087
Inpatient bed utilisation
0.093
0.094
0.001
1.075269
Labour bed utilisation
0.281
0.285
0.004
1.423488
Mean length of OPD queue (number of patients)
0.817
0.813
0.004
-0.489596
OPD queue waiting time (minutes)
6.789
6.937
0.148
2.179997
Mean length of pharmacy queue (number of patients)
0.150
0.150
0.000
0.000000
Pharmacy queue waiting time (minutes)
1.282
1.282
0.000
0.000000
Mean length of Lab queue (number of patients)
0.188
0.186
0.002
-1.063830
Lab queue waiting time (minutes)
3.135
3.124
0.011
-0.350877
Fraction of childbirth cases referred
0.157
0.166
0.009
5.732484
benchmark_sd
model_t6_c4_sd
change_model_t6_c4_sd
pct_change_model_t6_c4_sd
t6_outcome
Doctor utilisation
0.006
0.005
0.001
-16.666667
NCD Nurse utilisation
0.019
0.015
0.004
-21.052632
Staff nurse utilisation
0.008
0.009
0.001
12.500000
Pharmacist utilisation
0.005
0.004
0.001
-20.000000
Lab utilisation
0.011
0.015
0.004
36.363636
Inpatient bed utilisation
0.004
0.004
0.000
0.000000
Labour bed utilisation
0.012
0.013
0.001
8.333333
Mean length of OPD queue (number of patients)
0.027
0.040
0.013
48.148148
OPD queue waiting time (minutes)
0.268
0.317
0.049
18.283582
Mean length of pharmacy queue (number of patients)
0.002
0.003
0.001
50.000000
Pharmacy queue waiting time (minutes)
0.018
0.020
0.002
11.111111
Mean length of Lab queue (number of patients)
0.001
0.006
0.005
500.000000
Lab queue waiting time (minutes)
0.005
0.082
0.077
1540.000000
Fraction of childbirth cases referred
0.180
0.019
0.161
-89.444444
Format model results like table 6, and save
compare_col = [ ['Configuration 1', 'model_t6_c1_mean', 'model_t6_c1_sd'], ['Configuration 2', 'model_t6_c2_mean', 'model_t6_c2_sd'], ['Configuration 3', 'model_t6_c3_mean', 'model_t6_c3_sd'], ['Benchmark Case', 'model_t6_c4_mean', 'model_t6_c4_sd']]# Combine each pair of columns into string as in Table 6for col in compare_col: compare[col[0]] = (round(compare[col[1]], 3).astype(str) +' ('+round(compare[col[2]], 3).astype(str) +')')# Set outcome name as index, and select those columnsformatted_model_res = (compare .set_index('t6_outcome') .rename_axis('Simulation Outcome')[ [item[0] for item in compare_col]])formatted_model_res
Configuration 1
Configuration 2
Configuration 3
Benchmark Case
Simulation Outcome
Doctor utilisation
0.269 (0.002)
0.372 (0.004)
0.354 (0.001)
1.141 (0.005)
NCD Nurse utilisation
0.868 (0.01)
0.467 (0.004)
0.467 (0.004)
1.23 (0.015)
Staff nurse utilisation
0.318 (0.007)
0.246 (0.006)
0.161 (0.001)
0.326 (0.009)
Pharmacist utilisation
0.643 (0.003)
0.289 (0.003)
0.288 (0.003)
0.854 (0.004)
Lab utilisation
0.555 (0.007)
0.254 (0.003)
0.239 (0.004)
0.729 (0.015)
Inpatient bed utilisation
0.092 (0.004)
0.057 (0.004)
0.012 (0.001)
0.094 (0.004)
Labour bed utilisation
0.28 (0.014)
0.157 (0.007)
nan (nan)
0.285 (0.013)
Mean length of OPD queue (number of patients)
0.001 (0.0)
0.007 (0.001)
0.001 (0.0)
0.813 (0.04)
OPD queue waiting time (minutes)
0.008 (0.004)
0.178 (0.032)
0.035 (0.002)
6.937 (0.317)
Mean length of pharmacy queue (number of patients)
0.09 (0.003)
0.01 (0.0)
0.009 (0.0)
0.15 (0.003)
Pharmacy queue waiting time (minutes)
1.028 (0.031)
0.244 (0.005)
0.23 (0.006)
1.282 (0.02)
Mean length of Lab queue (number of patients)
0.095 (0.003)
0.012 (0.0)
0.011 (0.0)
0.186 (0.006)
Lab queue waiting time (minutes)
2.093 (0.044)
0.597 (0.016)
0.561 (0.024)
3.124 (0.082)
Fraction of childbirth cases referred
0.148 (0.015)
0.092 (0.01)
nan (nan)
0.166 (0.019)
formatted_model_res.to_csv(final_results)
Run time
# Find run time in secondsend = time.time()runtime =round(end-start)# Display converted to minutes and secondsprint(f'Notebook run time: {runtime//60}m {runtime%60}s')