| Consultation time: mean (SD) | (1/1/1) | (2/1/1) | (2/2/2) | Output | |
|---|---|---|---|---|---|
| 0 | 0.87 (0.21) | 0.011 | 0.010 | 0.023 | OPD queue waiting time (minutes) |
| 1 | 2.5 (0.5) | 0.121 | 0.124 | 0.158 | OPD queue waiting time (minutes) |
| 2 | 0.87 (0.21) | 2.069 | 2.070 | 2.110 | Lab queue waiting time (minutes) |
| 3 | 2.5 (0.5) | 2.314 | 2.322 | 2.308 | Lab queue waiting time (minutes) |
Summary report
For computational reproducibility assessment of Shoaib and Ramamohan 2022
Study
Shoaib M, Ramamohan V. Simulation modeling and analysis of primary health center operations. SIMULATION 98(3):183-208. (2022). https://doi.org/10.1177/00375497211030931.
This is a discrete-event simulation modelling primary health centres (PHCs) in India. There are four patient types: outpatients, inpatients, childbirth cases and antenatal care patients. Four model configurations are developed based on observed PHC practices or government-mandated operational guidelines. The paper explores different operational patterns for scenarios where very high utilisation was observed, to explore what might help reduce utilisation of these resources.
Images on this page are sourced from Shoaib and Ramamohan (2021), which is shared under CC BY-NC-ND.
Computational reproducibility
Successfully reproduced 16 out of 17 (94%) of items in the scope in 28h 14m (70.6%).
Required troubleshooting:
- Environment - took a while to set-up the environment with all packages and versions needed (some packages not listed in imports, and lots of confusion around statistics package which has base from Python 3.4 and a version on conda)
- Results spreadsheets - there were two possible results spreadsheets, and between and within these, there were multiple metrics for the same output that sometimes had differing results. Had to identify which spreadsheet and metric to use, as well as add some outputs that were missing.
- Programmatically changing parameter values - had to modify script to remove some hard-coded parameters, and to allow parameters to modified by a second script (rather than needing to directly change the model code)
- Replications and run time - due to slow model run time, set up parallel processing and reduced the number of replications
- Identifying parameters for each scenario - the configuration parameters were mostly provided in a table, whilst the scenarios were largely described in the text. It took some time to identify the parameters/context of each scenario, particuarly as there were sometimes discrepancies, and as some scenarioes were quite ambiguous and I initially misunderstood them
- Estimating parameters - had to estimate/guess some inter-arrival times and consultation boundaries, as they were not provided, and a method to calculate them was not provided
- Writing code to create tables and figures
- Working out how to change the model for each scenario - for several scenarios, it took some time looking through the model code to understand how I needed to change it to implement a scenario
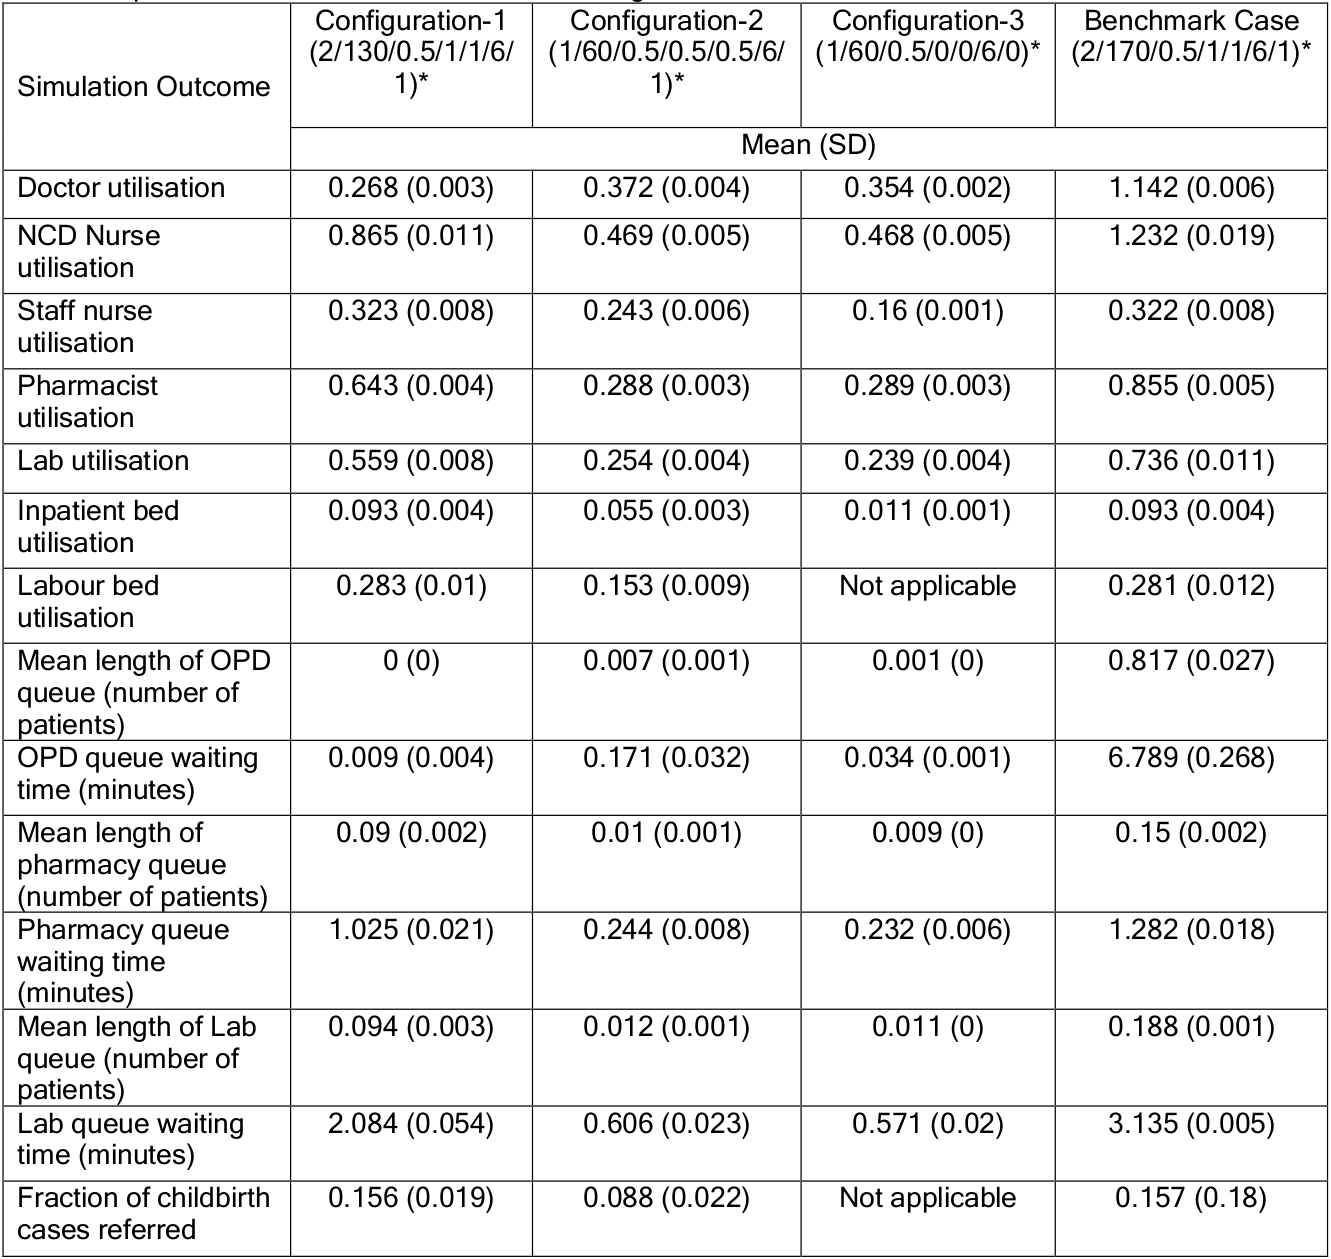
Table 6. “Operational outcomes for each PHC configuration simulation. * Number of doctors/OPD cases/IPD cases/childbirth/ANC (patients)/inpatient beds/labour room” Shoaib and Ramamohan (2021)
Figure 2a. “Impact on doctor’s utilisation.” Shoaib and Ramamohan (2021)
Figure 2b. “Impact on the NCD nurse’s utilisation.” Shoaib and Ramamohan (2021)
Figure 2c. “Impact on the average waiting time (minutes) in the OPD”. Shoaib and Ramamohan (2021)
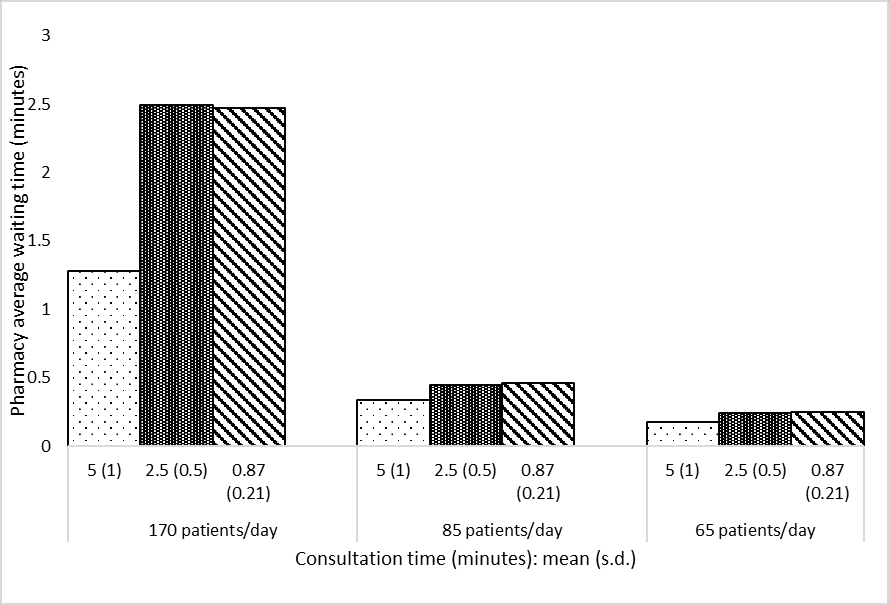
Figure 2d. “Impact on the average waiting time (minutes) in the pharmacy”. Shoaib and Ramamohan (2021)
Figure 3a. “Impact on the doctor’s utilisation. Two levels of outpatient consultation times (minutes) are used”. Shoaib and Ramamohan (2021)
Figure 3b. “Impact on the staff nurse’s utilisation”. Shoaib and Ramamohan (2021)
Figure 3c. “Impact on the inpatient bed’s utilisation”. Shoaib and Ramamohan (2021)
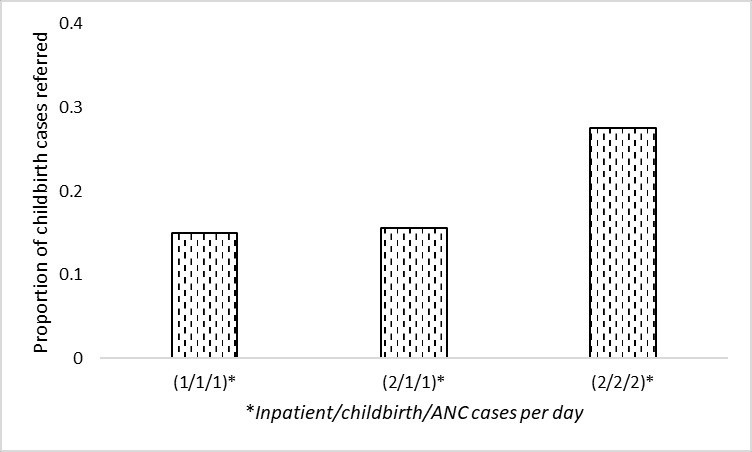
Figure 3d. “Impact on the proportion of childbirth cases referred elsewhere”. Shoaib and Ramamohan (2021)
Figure 4. “Effect of including additional labour beds on proportion of childbirth patients referred elsewhere”. Shoaib and Ramamohan (2021)
“We also note that waiting times for outpatient-related resources (laboratory, OPD consultation, etc. - not depicted in Figures 3a – 3d) increase marginally because the associated resources are also required by inpatient/childbirth/ANC cases, which increase in number in the above scenarios” Shoaib and Ramamohan (2021)
Reproduction (marginal increases from (1/1/1) through to (2/2/2)):
“To address this, we experimented with letting the staff nurse (whose utilisation is approximately 32%) take over the administrative work. This led to a 12% drop in the utilisation level, which implied that the doctor’s utilisation still exceeded 100%. Implementing this measure resulted in increasing the staff nurse utilisation to nearly 40%.” Shoaib and Ramamohan (2021)
| Output | Original utilisation | Utilisation if admin is assigned to the staff nurse | Change | |
|---|---|---|---|---|
| 0 | Doctor utilisation | 1.141 | 1.023 | -0.118 |
| 1 | Staff nurse utilisation | 0.326 | 0.404 | 0.078 |
“…then considered a situation wherein the staff nurses require minimal intervention in childbirth cases. We assumed that in 50% of childbirth cases, staff nurses require no intervention by the doctor; require only one- third of the typical amount of intervention in 30% of cases, and require full intervention in the remaining 20% of cases. This led to a decrease of the doctor’s utilisation to 101% (a further decrease of approximately 1%), and an increase in the nurse’s utilisation to 40%.” Shoaib and Ramamohan (2021)
| Output | Normal | Less delivery | Less admin | Less admin + less delivery | |
|---|---|---|---|---|---|
| 0 | Doctor utilisation | 1.141 | 1.131 | 1.023 | 1.013 |
| 1 | Staff nurse utilisation | 0.326 | 0.323 | 0.404 | 0.402 |
“..investigated the effect of stationing an additional doctor in the PHC. This yielded an average utilisation of well below 100% for each doctor.” Shoaib and Ramamohan (2021)
| Output | Normal | Extra doctor | Extra doctor + less admin + less delivery | |
|---|---|---|---|---|
| 0 | Doctor utilisation | 1.141 | 0.761 | 0.675 |
“We also observe that if the number of beds is reduced to four from six, the utilisation level is observed to be approximately thirty-three percent even under higher demand conditions (two inpatient and childbirth cases/day).” Shoaib and Ramamohan (2021)
| Output | 6 beds | 4 beds | |
|---|---|---|---|
| 0 | Inpatient bed utilisation (metric 1) | 0.186271 | 0.280377 |
| 1 | Inpatient bed utilisation (metric 2) | 0.198000 | 0.297000 |
“When the administrative work alone is assigned to the staff nurse the average utilisation of the NCD nurse decreases to 100%” Shoaib and Ramamohan (2021)
| Output | Normal | Admin from NCD to staff nurse | |
|---|---|---|---|
| 0 | NCD nurse utilisation | 1.232 | 0.995 |
“Further, in addition to the administrative work when the staff nurse assisted for NCD checks (for 10% cases) the utilisation of NCD nurse dropped to 71%.” Shoaib and Ramamohan (2021)
| Output | Normal | Admin from NCD to staff nurse | 10% OPD appointments from NCD to staff nurse | Admin and 10% OPD appointments from NCD to staff nurse | |
|---|---|---|---|---|---|
| 0 | NCD nurse utilisation | 1.232 | 0.995 | 1.069 | 0.834 |
Evaluation against guidelines
Context: The original study repository was evaluated against criteria from journal badges relating to how open and reproducible the model is and against guidance for sharing artefacts from the STARS framework. The original study article and supplementary materials (excluding code) were evaluated against reporting guidelines for DES models: STRESS-DES, and guidelines adapted from ISPOR-SDM.


