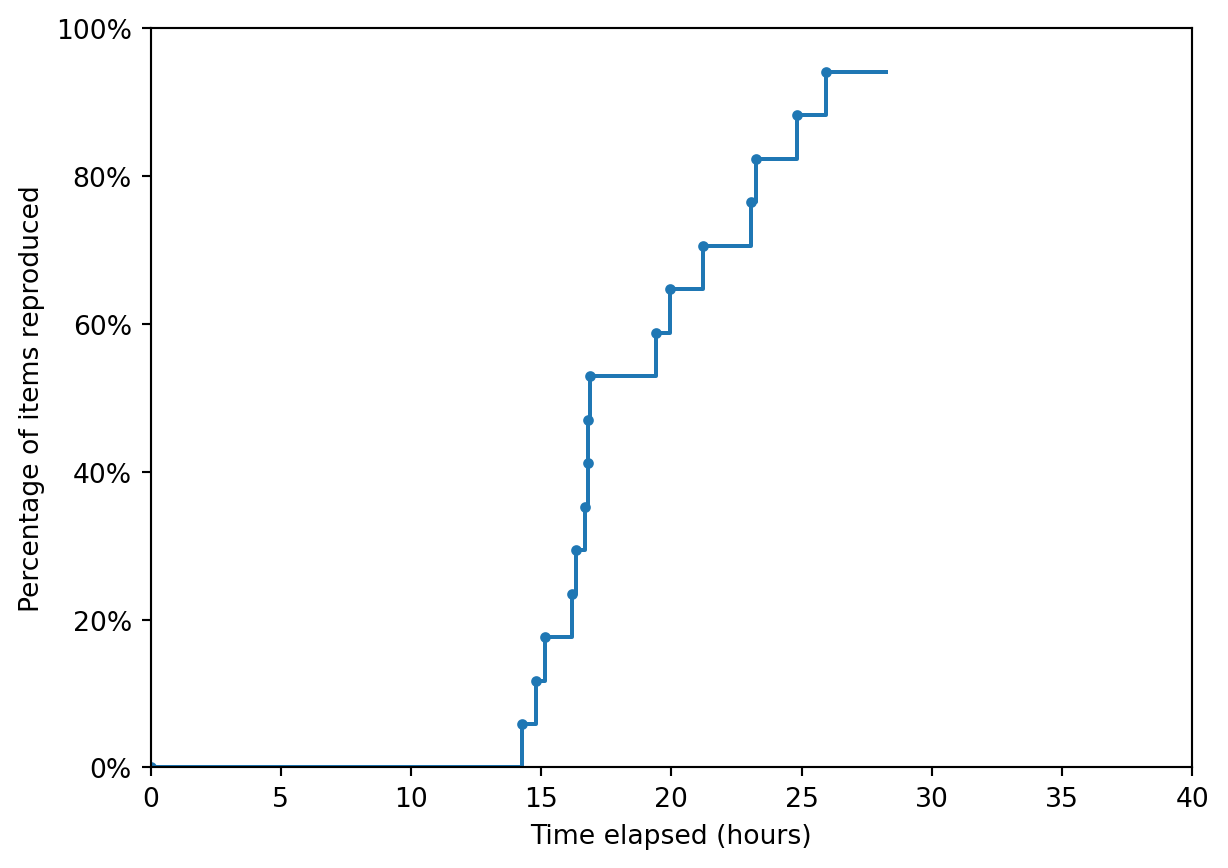
Of the 17 items in the scope, 94% (16 out of 17) were considered to be successfully reproduced.
As cited throughout, images on this page are sourced from Shoaib and Ramamohan (2021), which is shared under CC BY-NC-ND.
Unless otherwise stated, items were run with 10 replications rather than 100. This is because 100 replications took a long time to run, and as results were very similar between 10 and 100 replications.
Time-to-completion
Non-interactive plot:
Interactive plot:
Reproduction of items from the scope
Consensus: Successfully reproduced
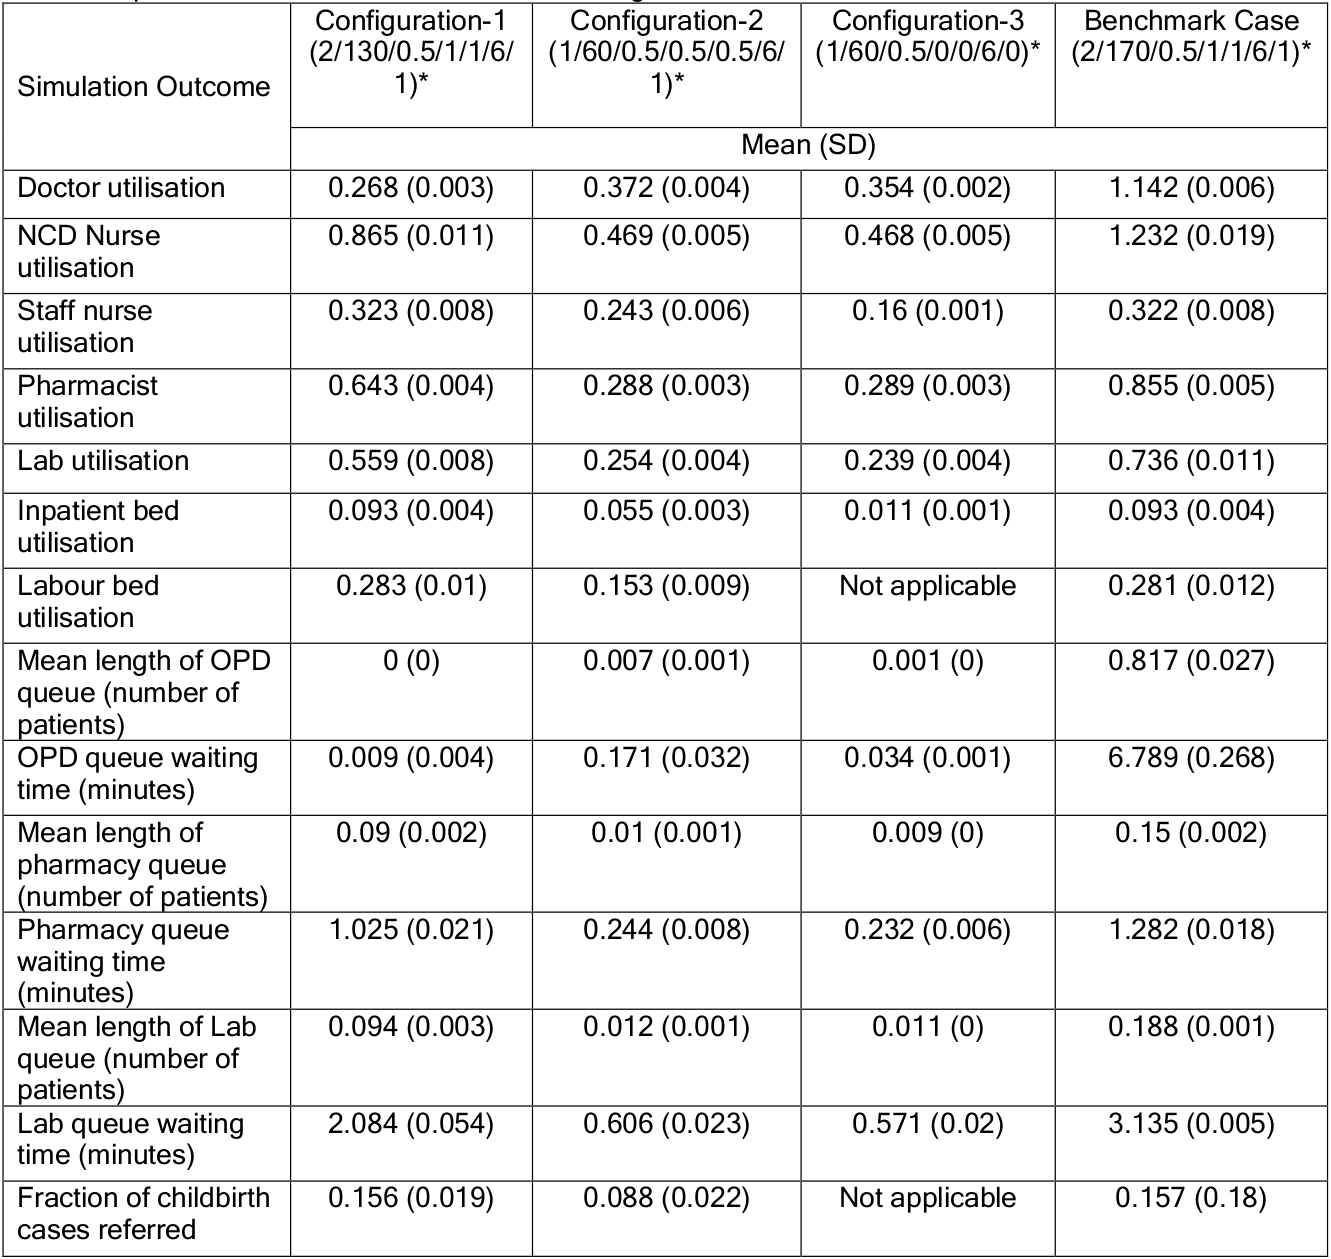
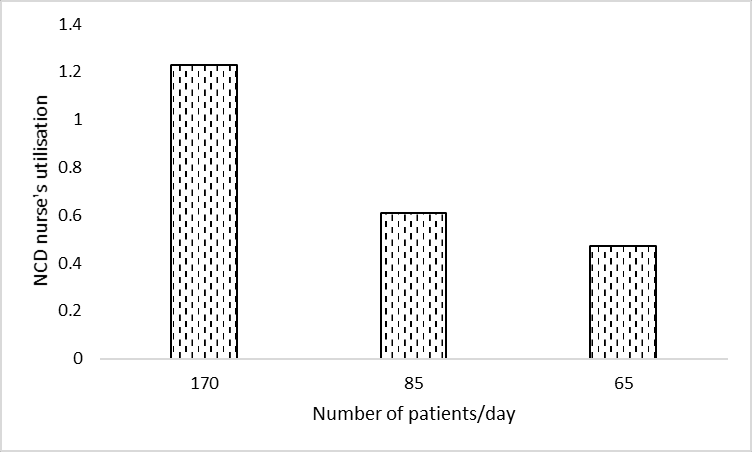
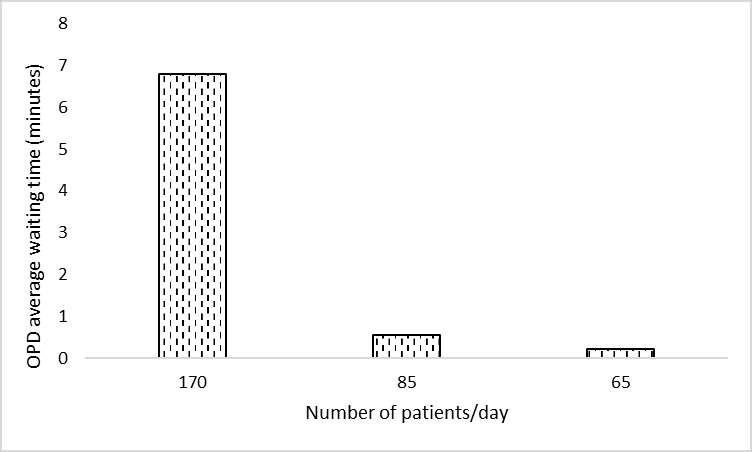
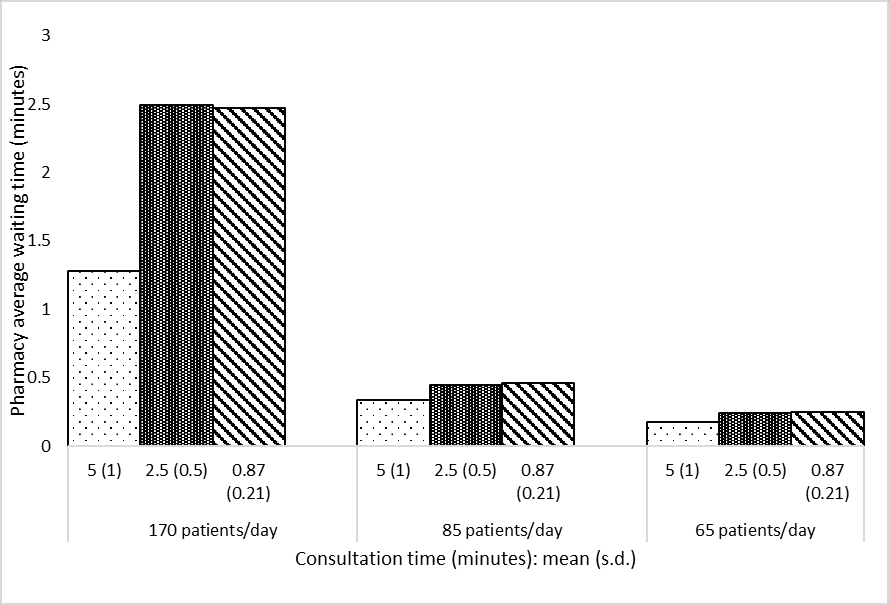
Original (Shoaib and Ramamohan (2021)):
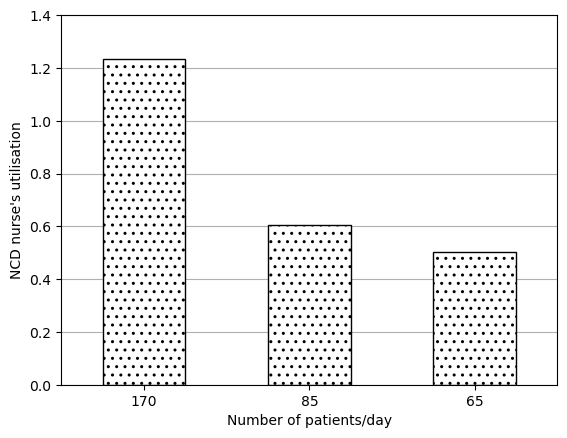
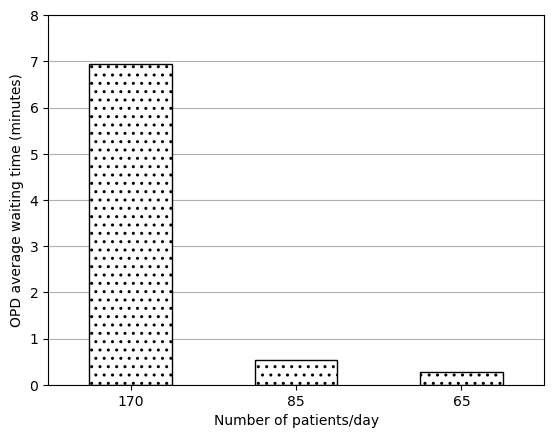
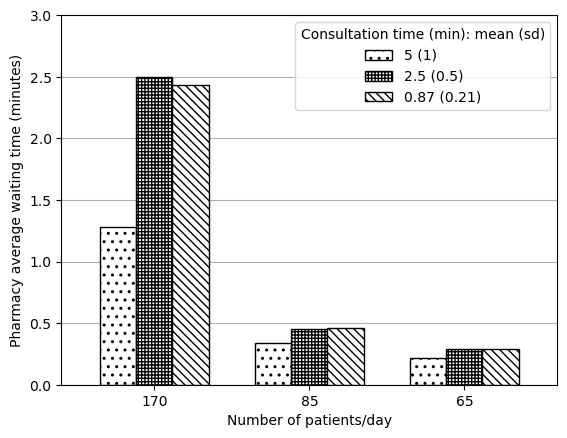
Reproduction:
| 0 |
Doctor utilisation |
0.269 (0.002) |
0.372 (0.004) |
0.354 (0.001) |
1.141 (0.005) |
| 1 |
NCD Nurse utilisation |
0.868 (0.01) |
0.467 (0.004) |
0.467 (0.004) |
1.23 (0.015) |
| 2 |
Staff nurse utilisation |
0.318 (0.007) |
0.246 (0.006) |
0.161 (0.001) |
0.326 (0.009) |
| 3 |
Pharmacist utilisation |
0.643 (0.003) |
0.289 (0.003) |
0.288 (0.003) |
0.854 (0.004) |
| 4 |
Lab utilisation |
0.555 (0.007) |
0.254 (0.003) |
0.239 (0.004) |
0.729 (0.015) |
| 5 |
Inpatient bed utilisation |
0.092 (0.004) |
0.057 (0.004) |
0.012 (0.001) |
0.094 (0.004) |
| 6 |
Labour bed utilisation |
0.28 (0.014) |
0.157 (0.007) |
nan (nan) |
0.285 (0.013) |
| 7 |
Mean length of OPD queue (number of patients) |
0.001 (0.0) |
0.007 (0.001) |
0.001 (0.0) |
0.813 (0.04) |
| 8 |
OPD queue waiting time (minutes) |
0.008 (0.004) |
0.178 (0.032) |
0.035 (0.002) |
6.937 (0.317) |
| 9 |
Mean length of pharmacy queue (number of patie... |
0.09 (0.003) |
0.01 (0.0) |
0.009 (0.0) |
0.15 (0.003) |
| 10 |
Pharmacy queue waiting time (minutes) |
1.028 (0.031) |
0.244 (0.005) |
0.23 (0.006) |
1.282 (0.02) |
| 11 |
Mean length of Lab queue (number of patients) |
0.095 (0.003) |
0.012 (0.0) |
0.011 (0.0) |
0.186 (0.006) |
| 12 |
Lab queue waiting time (minutes) |
2.093 (0.044) |
0.597 (0.016) |
0.561 (0.024) |
3.124 (0.082) |
| 13 |
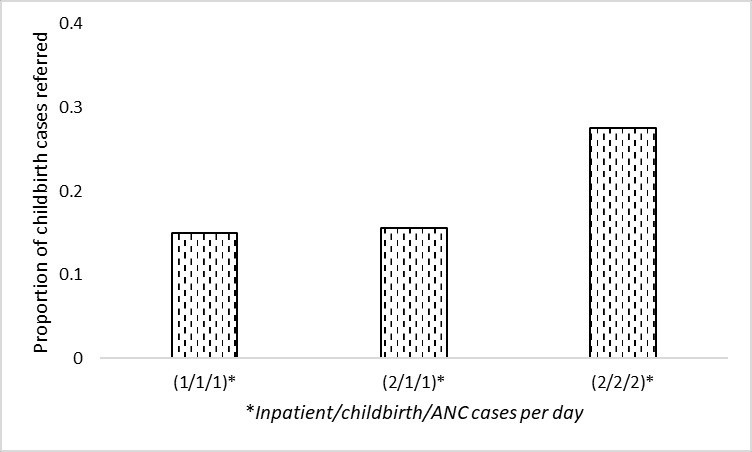
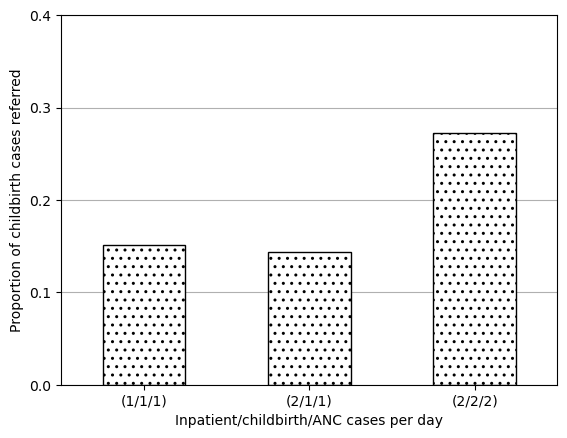
Fraction of childbirth cases referred |
0.148 (0.015) |
0.092 (0.01) |
nan (nan) |
0.166 (0.019) |
Consensus: Successfully reproduced
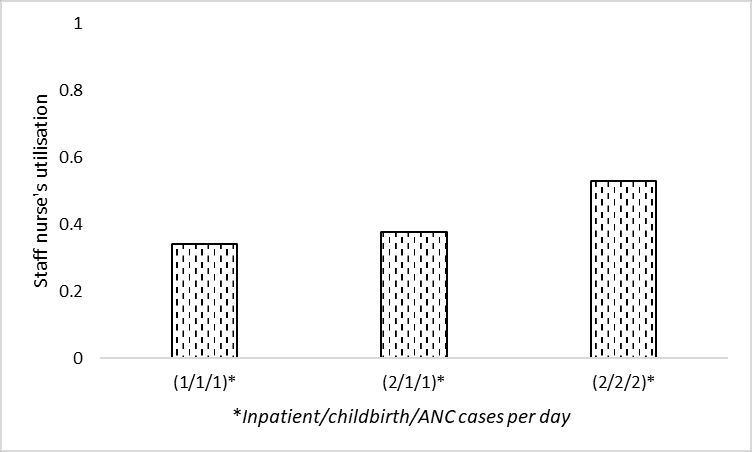
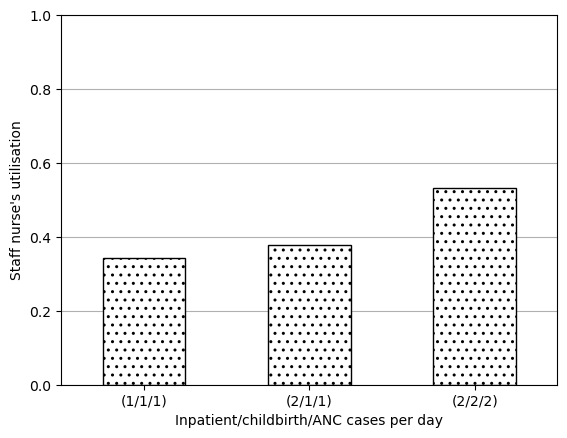
Original (Shoaib and Ramamohan (2021)):
Reproduction:
Consensus: Successfully reproduced
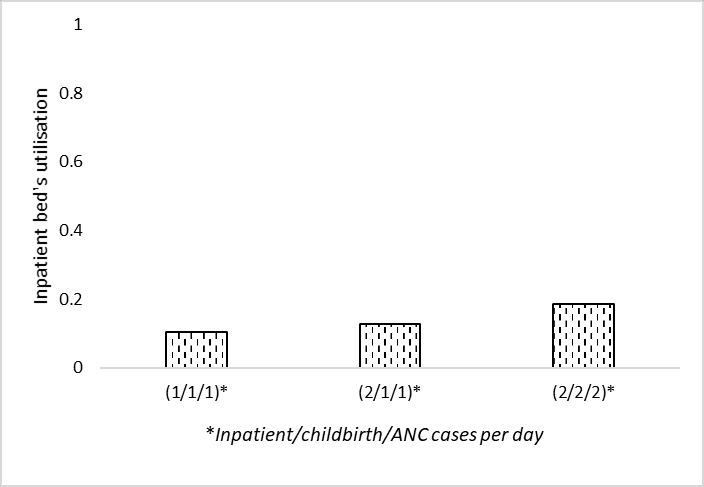
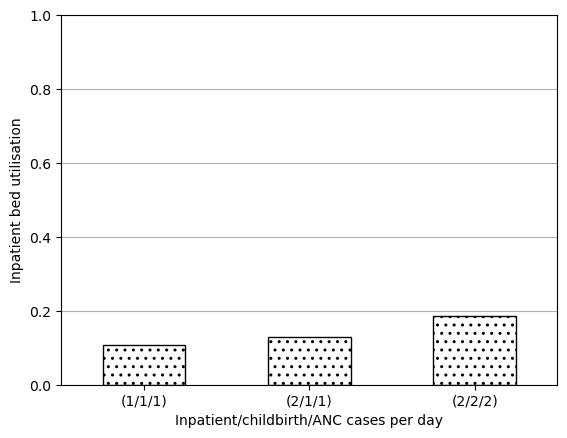
Original (Shoaib and Ramamohan (2021)):
Reproduction:
Consensus: Successfully reproduced
Original (Shoaib and Ramamohan (2021)):
Reproduction:
Consensus: Successfully reproduced
Original (Shoaib and Ramamohan (2021)):
Reproduction:
Consensus: Successfully reproduced
Original (Shoaib and Ramamohan (2021)):
Reproduction:
Consensus: Successfully reproduced
Original (Shoaib and Ramamohan (2021)):
Reproduction:
Consensus: Successfully reproduced
Original (Shoaib and Ramamohan (2021)):
Reproduction:
Consensus: Successfully reproduced
Original (Shoaib and Ramamohan (2021)):
Reproduction:
Consensus: Successfully reproduced
Original (Shoaib and Ramamohan (2021)):
Reproduction:
Consensus: Successfully reproduced
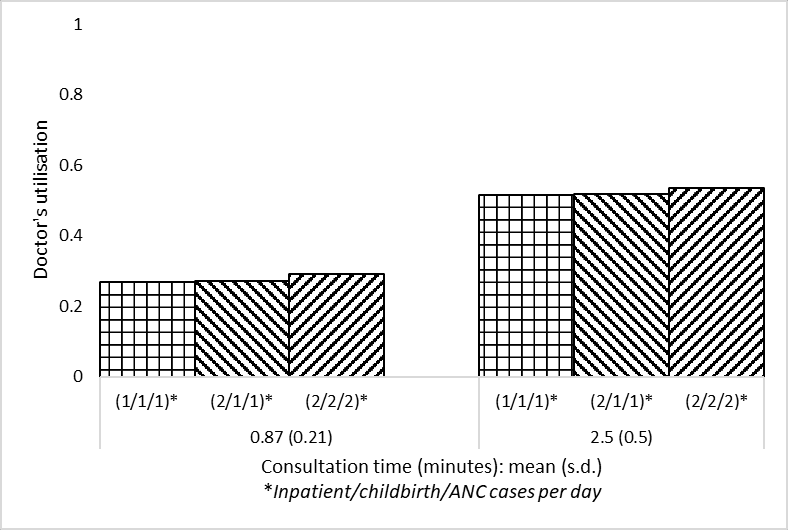
Original:
From section 4.3: “We also note that waiting times for outpatient-related resources (laboratory, OPD consultation, etc. - not depicted in Figures 3a – 3d) increase marginally because the associated resources are also required by inpatient/childbirth/ANC cases, which increase in number in the above scenarios”
Interpretation:
- Run sensitivity analysis as in Figures 3A-D, but look at outcomes relating to laboratory and outpatient waiting times
- Result: marginal increase
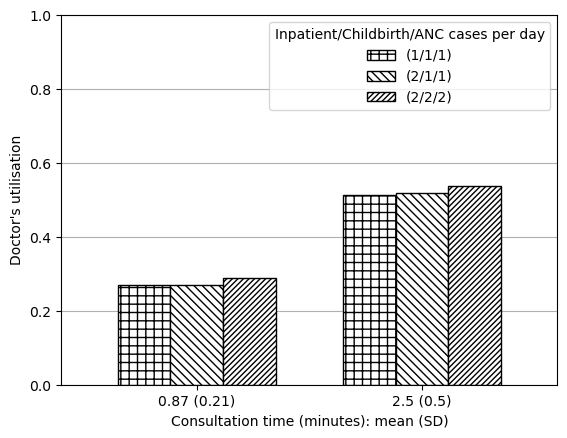
Reproduction:
We observed marginal increases (e.g. .1 or 0.01 of a minute).
| 0 |
0.87 (0.21) |
0.011 |
0.010 |
0.023 |
OPD queue waiting time (minutes) |
| 1 |
2.5 (0.5) |
0.121 |
0.124 |
0.158 |
OPD queue waiting time (minutes) |
| 2 |
0.87 (0.21) |
2.069 |
2.070 |
2.110 |
Lab queue waiting time (minutes) |
| 3 |
2.5 (0.5) |
2.314 |
2.322 |
2.308 |
Lab queue waiting time (minutes) |
Consensus: Successfully reproduced
Original:
From section 4.3.1: “To address this, we experimented with letting the staff nurse (whose utilisation is approximately 32%) take over the administrative work. This led to a 12% drop in the utilisation level, which implied that the doctor’s utilisation still exceeded 100%. Implementing this measure resulted in increasing the staff nurse utilisation to nearly 40%.”
Interpretation:
- Average patient load of 170 per day
- Average consultation time of 5 min per patient
- Change doctor to have no administrative work, and assign all to staff nurse
- Results: doctor utilisation 103%, staff nurse utilisation nearly 40%
Reproduction:
We observe doctor utilisation drop 12% (114% to 102%), and staff nurse utilisation rise from 32% to 40%.
| 0 |
Doctor utilisation |
1.141 |
1.023 |
-0.118 |
| 1 |
Staff nurse utilisation |
0.326 |
0.404 |
0.078 |
Consensus: Successfully reproduced
Original:
From section 4.3.1: “then considered a situation wherein the staff nurses require minimal intervention in childbirth cases. We assumed that in 50% of childbirth cases, staff nurses require no intervention by the doctor; require only one- third of the typical amount of intervention in 30% of cases, and require full intervention in the remaining 20% of cases. This led to a decrease of the doctor’s utilisation to 101% (a further decrease of approximately 1%), and an increase in the nurse’s utilisation to 40%.”
Interpretation:
- Average patient load of 170 per day
- Average consultation time of 5 min per patient
- Change doctors from always attending childbirth cases when free to 50% not attending, 30% attending but for one-third of normal time, 20% attending for normal time
- Result: Doctor utilisation 101% and nurse utilisation 40%
Reproduction:
The above interpretation was incorrect - this result is obtained by changing the delivery in addition to the admin changes.
Doctor utilisation decreases by a further 1% (102% to 101%). No change in staff nurse utilisation - but remains around 40%, and the original paper describes the nurse utilisation as not changing significantly, and from changing from “nearly 40%” to 40%, so our slight difference from that is very small and likely just model stochasticity and having run 10 replications.
| 0 |
Doctor utilisation |
1.141 |
1.131 |
1.023 |
1.013 |
| 1 |
Staff nurse utilisation |
0.326 |
0.323 |
0.404 |
0.402 |
Consensus: Successfully reproduced
Original:
From section 4.3.1: “investigated the effect of stationing an additional doctor in the PHC. This yielded an average utilisation of well below 100% for each doctor.”
Interpretation:
- Average patient load of 170 per day
- Average consultation time of 5 min per patient
- Add a doctor
- Result: each doctor has utilisation “well below 100%”
Reproduction:
The exact parameters of the scenario are ambiguous. However, regardless of whether the additional doctor is alone (as in interpretation above), or in addition to the previous admin and delivery changes (as was the case for in-text result 3), in both cases the doctor utilisation can safely be described as “well below 100%”.
| 0 |
Doctor utilisation |
1.141 |
0.761 |
0.675 |
Consensus: Successfully reproduced
Original:
From section 4.3.2: “We also observe that if the number of beds is reduced to four from six, the utilisation level is observed to be approximately thirty-three percent even under higher demand conditions (two inpatient and childbirth cases/day).”
Interpretation:
- Reduce from six to four inpatient beds
- Conditions un-specified (assume standard, and also high demand (2 inpatient and childbirth cases per day))
- Result: Approximately 33% utilisation
Reproduction:
For this result, I realised there were two metrics for bed utilisation being calculated. In prior results (e.g. Figure 3C), I used the first metric, which was calculated manually by the original study author. The second metric is the occupancy returned by the bed SimPy resource. Regardless of which metric we might or should use, both have fairly similar results (differing by 1%) - either raising from 19% to 28%, or from 20% to 30%.
Although this is a bit different from the original study result, I feel it is reasonably similar enough - and a marked increase - to be considered successfully reproduced.
| 0 |
Inpatient bed utilisation (metric 1) |
0.186271 |
0.280377 |
| 1 |
Inpatient bed utilisation (metric 2) |
0.198000 |
0.297000 |
Consensus: Successfully reproduced
Original:
From section 4.3.3: “When the administrative work alone is assigned to the staff nurse the average utilisation of the NCD nurse decreases to 100%”
Interpretation:
- Outpatient interarrival time 3 minutes
- No administrative work for NCD nurse, only assigned to staff nurse
- Result: NCD nurse utilisation 100%
Reproduction:
| 0 |
NCD nurse utilisation |
1.232 |
0.995 |
Consensus: Not reproduced
Original:
From section 4.3.3: “Further, in addition to the administrative work when the staff nurse assisted for NCD checks (for 10% cases) the utilisation of NCD nurse dropped to 71%.”
Interpretation:
- Outpatient interarrival time 3 minutes
- Potentially combined with change in administrative work
- Assigned staff nurse for 10% of NCD cases
- Result: NCD nurse utilisation 71%
Reproduction:
We see a large decrease, but still a fair bit higher than 71%. We get a closer result if we set 20% of cases to be referred to the staff nurse.
Result when 10% cases are transferred (10 replications):
| 0 |
NCD nurse utilisation |
1.232 |
0.995 |
1.069 |
0.834 |
Result when 10% cases are transferred (100 replications):
| 0 |
NCD nurse utilisation |
0.827 |
Result when 20% cases are transferred (10 replications):
| 0 |
NCD nurse utilisation |
0.69 |