# Clear environment
rm(list=ls())

# Start timer
start.time <- Sys.time()

# Disable scientific notation
options(scipen=999)

# Get the model and helper functions (but hide loading warnings for each package)
suppressMessages(source("model.R"))
suppressMessages(source("helpers.R"))

# Import other required libraries (if not otherwise import in R scripts below)
library(ggpubr)
library(tidyr, include.only = c("pivot_wider"))Reproduce supplementary figure
This is run in a separate script from the other figures due to issues with RStudio crashing when all scenarios were run from a single script.
If run is TRUE, it will run scenarios with double and triple the number of ECR patients.
To create the figure, it will use those files, as well as the baseline file created within reproduction.qmd.
Run time: 4.975 minutes (will vary between machines)
Set up
# Set the seed and default dimensions for figures
SEED = 200
DEFAULT_WIDTH = 7
DEFAULT_HEIGHT = 4

# Set file paths to save results
folder = "../outputs"

path_baseline_f2 <- file.path(folder, "fig2_baseline.csv.gz")
path_double_sup <- file.path(folder, "sup_baseline_double.csv.gz")
path_triple_sup <- file.path(folder, "sup_baseline_triple.csv.gz")

path_supfig <- file.path(folder, "supplementary_figure.png")
Run models
Set to true or false, depending on whether you want to run everything.
run <- FALSERun baseline with double and triple the number of ECR patients, for the supplementary figure.
if (isTRUE(run)) {
  baseline_sup2 <- run_model(seed = SEED, ecr_pt = 58*2)
  baseline_sup3 <- run_model(seed = SEED, ecr_pt = 58*3)
}
if (isTRUE(run)) {
# Save results
data.table::fwrite(baseline_sup2, path_double_sup)
data.table::fwrite(baseline_sup3, path_triple_sup)
# Remove the dataframes from environment
rm(baseline_sup2, baseline_sup3)
}Import results
Import the results, adding a column to each to indicate the scenario.
base_f2 <- import_results(path_baseline_f2, "Baseline")
base_sup_double <- import_results(path_double_sup, "Baseline (double)")
base_sup_triple <- import_results(path_triple_sup, "Baseline (triple)")
Supplementary figure
# Create sub-plots
p1 <- create_plot(base_f2,
                  group="resource",
                  title="Baseline",
                  ylab="Standardised density of patient in queue")
p2 <- create_plot(base_sup_double,
                  group="resource",
                  title="Doubling ECR patients",
                  xlab="Patient wait time (min)",
                  xlim=c(0, 300),
                  breaks_width=100)
p3 <- create_plot(base_sup_triple,
                  group="resource",
                  title="Tripling ECR patients",
                  xlim=c(0, 300))

# Arrange in a single figure
ggarrange(p1, p2, p3, nrow=1,
          common.legend=TRUE, legend="bottom",
          labels=c("A", "B", "C"))
Warning: Removed 1 row containing non-finite outside the scale range (`stat_density()`).
Removed 1 row containing non-finite outside the scale range (`stat_density()`).
Removed 1 row containing non-finite outside the scale range (`stat_density()`).
Removed 1 row containing non-finite outside the scale range (`stat_density()`).Warning: Removed 4 rows containing non-finite outside the scale range
(`stat_density()`).
Removed 4 rows containing non-finite outside the scale range
(`stat_density()`).Warning: Removed 3 rows containing non-finite outside the scale range
(`stat_density()`).
Removed 3 rows containing non-finite outside the scale range
(`stat_density()`).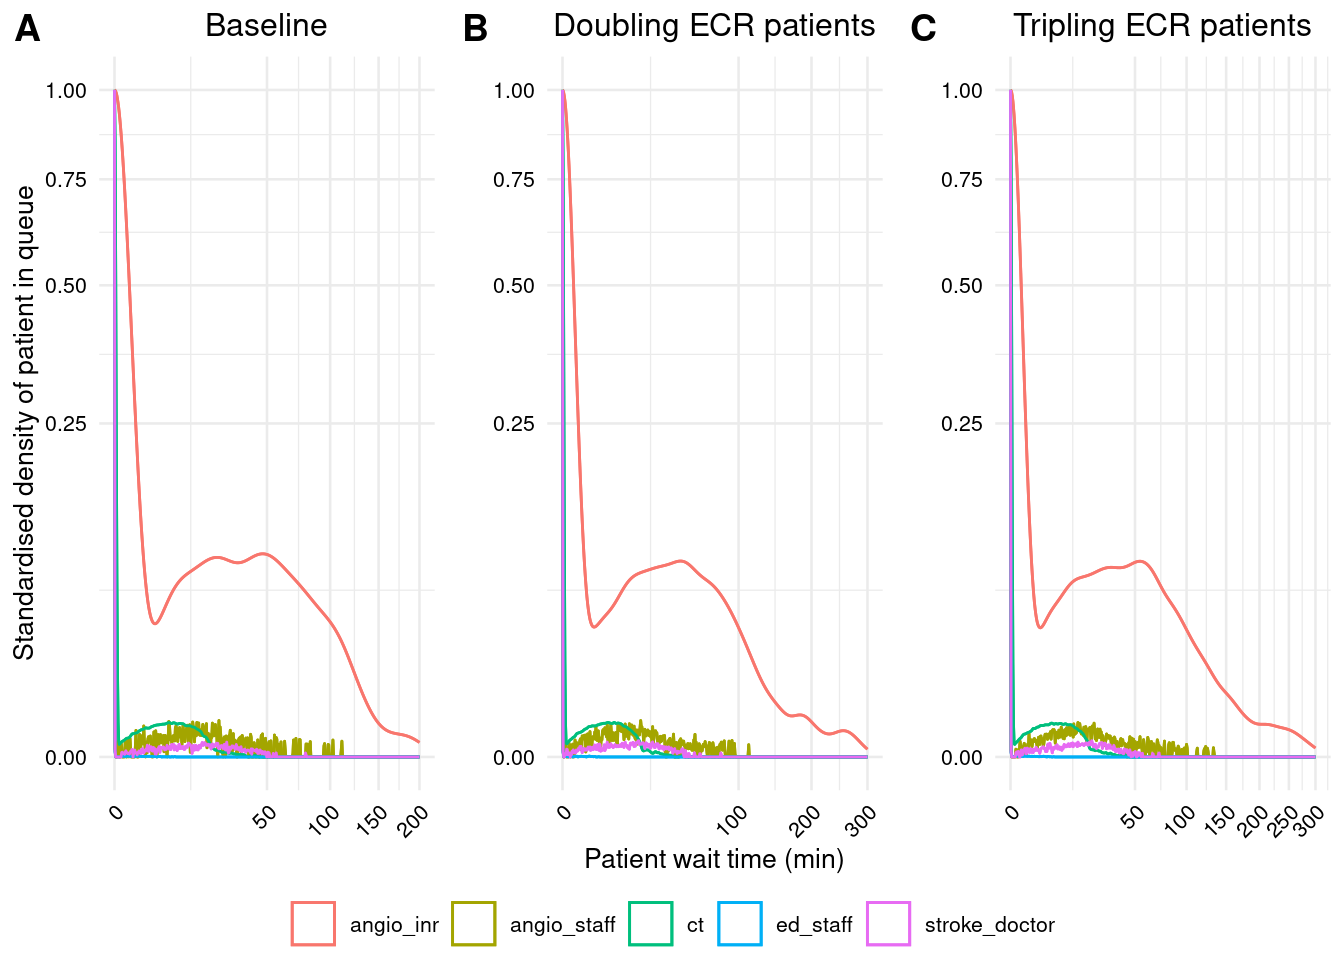
ggsave(path_supfig, width=DEFAULT_WIDTH, height=DEFAULT_HEIGHT)Time elapsed
if (isTRUE(run)) {
  end.time <- Sys.time()
  elapsed.time <- round((end.time - start.time), 3)
  elapsed.time
}