Scope

This page outlines the parts of the journal article which we will attempt to reproduce.

All images and quotes on this page are sourced from Huang et al. (2019)

Within scope

FIGURE 2 | Patient wait time under various simulation scenarios (A). Baseline scenario simulated using inputs from Table 1 (B). Exclusive-use scenario: IR patients can only utilize angioIR (C). Two angioINRs scenario: 2 angioINRs, no angioIRs. Standardized density of patients in queue: the probability density of patients who are waiting standardized to patients who are not waiting. Huang et al. (2019)

FIGURE 2 | Patient wait time under various simulation scenarios (A). Baseline scenario simulated using inputs from Table 1 (B). Exclusive-use scenario: IR patients can only utilize angioIR (C). Two angioINRs scenario: 2 angioINRs, no angioIRs. Standardized density of patients in queue: the probability density of patients who are waiting standardized to patients who are not waiting. Huang et al. (2019)

FIGURE 3 | The effect of increasing working hours on ECR patient wait time at angioINR (A). Baseline scenario (B). Exclusive-use scenario (C). Two angioINRs scenario. Standardized density of patients in queue: the probability density of patients who are waiting standardized to patients who are not waiting. Huang et al. (2019)

FIGURE 3 | The effect of increasing working hours on ECR patient wait time at angioINR (A). Baseline scenario (B). Exclusive-use scenario (C). Two angioINRs scenario. Standardized density of patients in queue: the probability density of patients who are waiting standardized to patients who are not waiting. Huang et al. (2019)

FIGURE 4 | Disability-free life gained under various scenarios. Huang et al. (2019)

FIGURE 4 | Disability-free life gained under various scenarios. Huang et al. (2019)

FIGURE 5 | A comparison of the utilization of angioINR by ECR patients under various scenarios. Huang et al. (2019)

FIGURE 5 | A comparison of the utilization of angioINR by ECR patients under various scenarios. Huang et al. (2019)

Supplementary Figure | Increasing ECR patient volume on service bottleneck. Standardized density of patients in queue: the probability density of patients who are waiting standardized to patients who are not waiting. (A) Baseline scenario. (B) Doubling ECR patients in baseline scenario. (C) Tripping ECR patients in baseline scenario. Huang et al. (2019)

Supplementary Figure | Increasing ECR patient volume on service bottleneck. Standardized density of patients in queue: the probability density of patients who are waiting standardized to patients who are not waiting. (A) Baseline scenario. (B) Doubling ECR patients in baseline scenario. (C) Tripping ECR patients in baseline scenario. Huang et al. (2019)

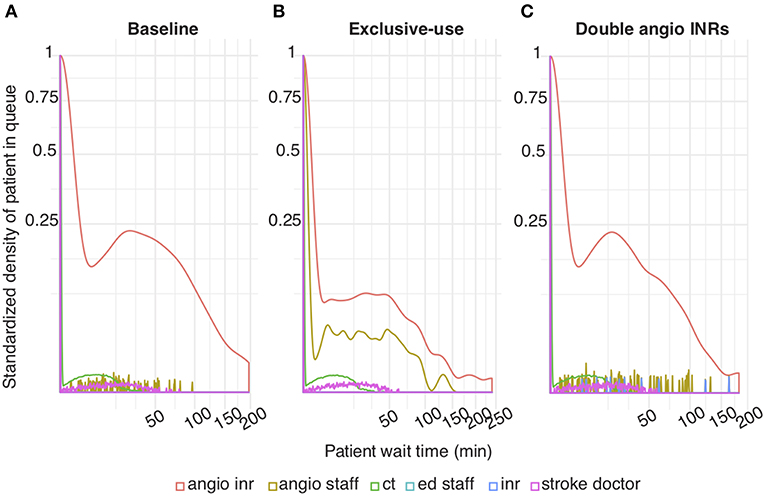
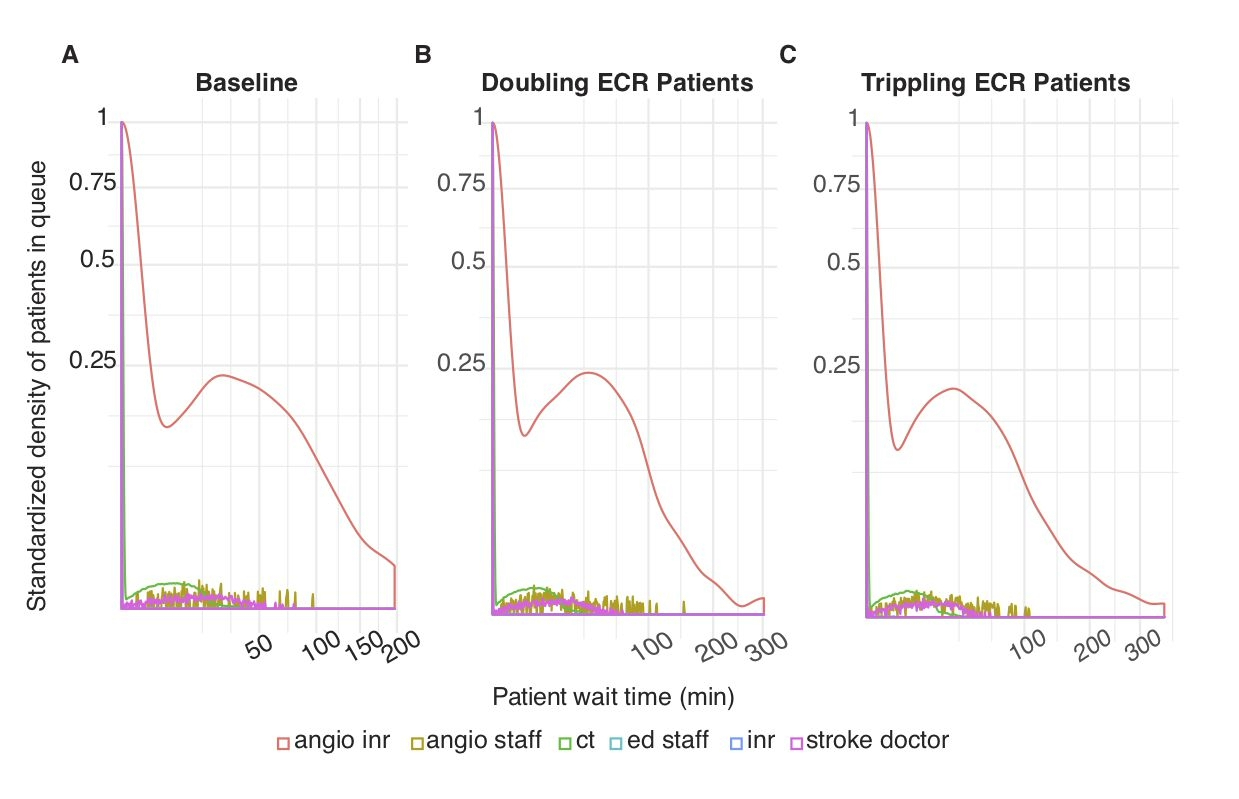
“Exclusive-Use Scenario. In this scenario, the overall wait time probability at angioINR was reduced compared to baseline (red line in Figure 2B compared to Figure 2A). This represents a decrease in ECR patient wait time for angioINR by an average of 6 min.” Huang et al. (2019)

“Two angioINRs Scenario. This scenario simulates the effect a facility upgrade to two biplane angiographic suites, but without additional staff changes. The wait time probability at angioINR was reduced compared to baseline (Figure 2C). The reduction represents an average of 4 min less in queue for angioINR.” Huang et al. (2019)

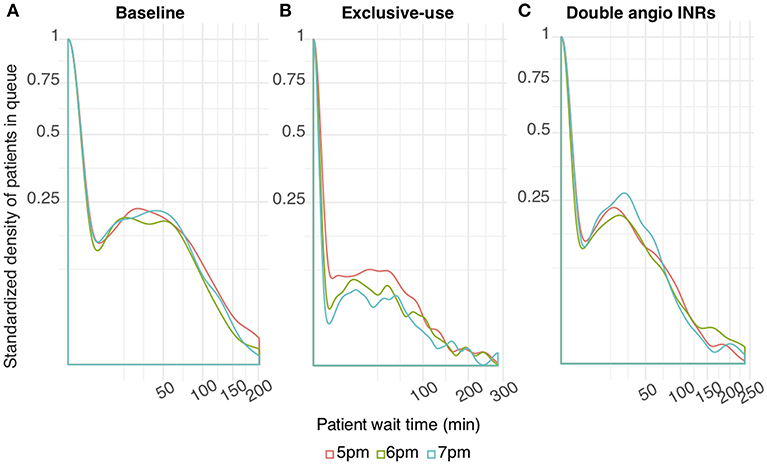
“Extended Schedule Scenario. The wait time probability at angioINR in the exclusive- use scenario was further reduced by extended work hours (Figure 3B). In contrast, work extension did not affect baseline or the 2 angioINRs scenario (Figures 3A,C). For the baseline scenario, 1 and 2 h of extra work resulted in an average wait time of 1.7 and 0.9 min reduction, respectively. For the 2 angioINRs scenario, 1 and 2 h of extra work resulted in an average wait time gain of 1 and 0.3 min, respectively.” Huang et al. (2019)

Outside scope

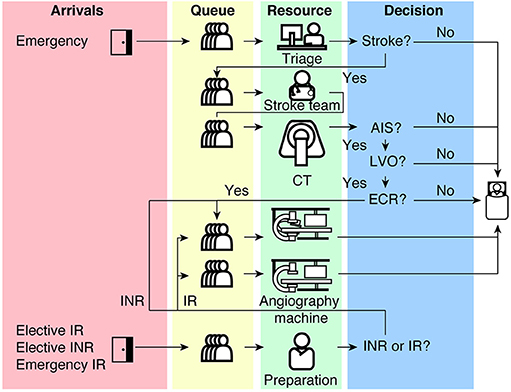
Diagram of patient flow through the model.

FIGURE 1 | A schematic diagram of our discrete event model of an ECR service from Emergency to angiography suite. CT, Computed Tomography; AIS, Acute Ischemic Stroke; LVO, Large Vessel Occlusion; ECR, Endovascular Clot Retrieval; IR, Interventional Radiology; INR, Interventional Neuroradiology. Huang et al. (2019)

FIGURE 1 | A schematic diagram of our discrete event model of an ECR service from Emergency to angiography suite. CT, Computed Tomography; AIS, Acute Ischemic Stroke; LVO, Large Vessel Occlusion; ECR, Endovascular Clot Retrieval; IR, Interventional Radiology; INR, Interventional Neuroradiology. Huang et al. (2019)

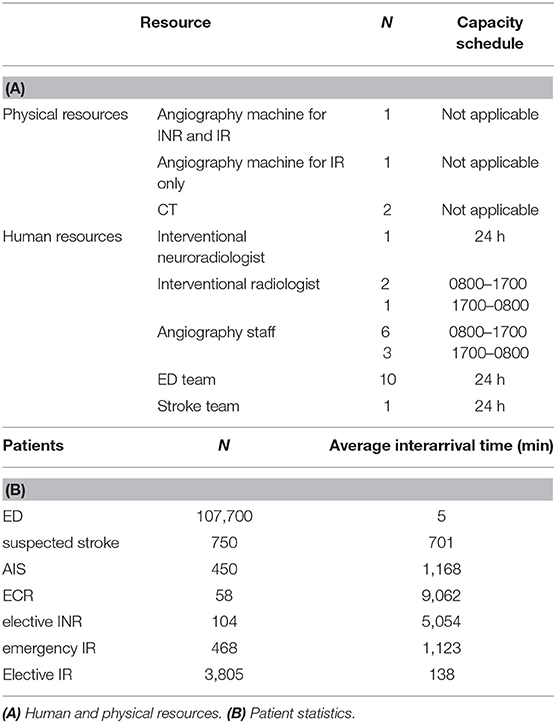
Parameters for the model.

TABLE 1 | DES model inputs. (A) Human and physical resources. (B) Patient statistics. Huang et al. (2019)

TABLE 1 | DES model inputs. (A) Human and physical resources. (B) Patient statistics. Huang et al. (2019)

References

Huang, Shiwei, Julian Maingard, Hong Kuan Kok, Christen D. Barras, Vincent Thijs, Ronil V. Chandra, Duncan Mark Brooks, and Hamed Asadi. 2019. “Optimizing Resources for Endovascular Clot Retrieval for Acute Ischemic Stroke, a Discrete Event Simulation.” Frontiers in Neurology 10 (June). https://doi.org/10.3389/fneur.2019.00653.