Reproduction success
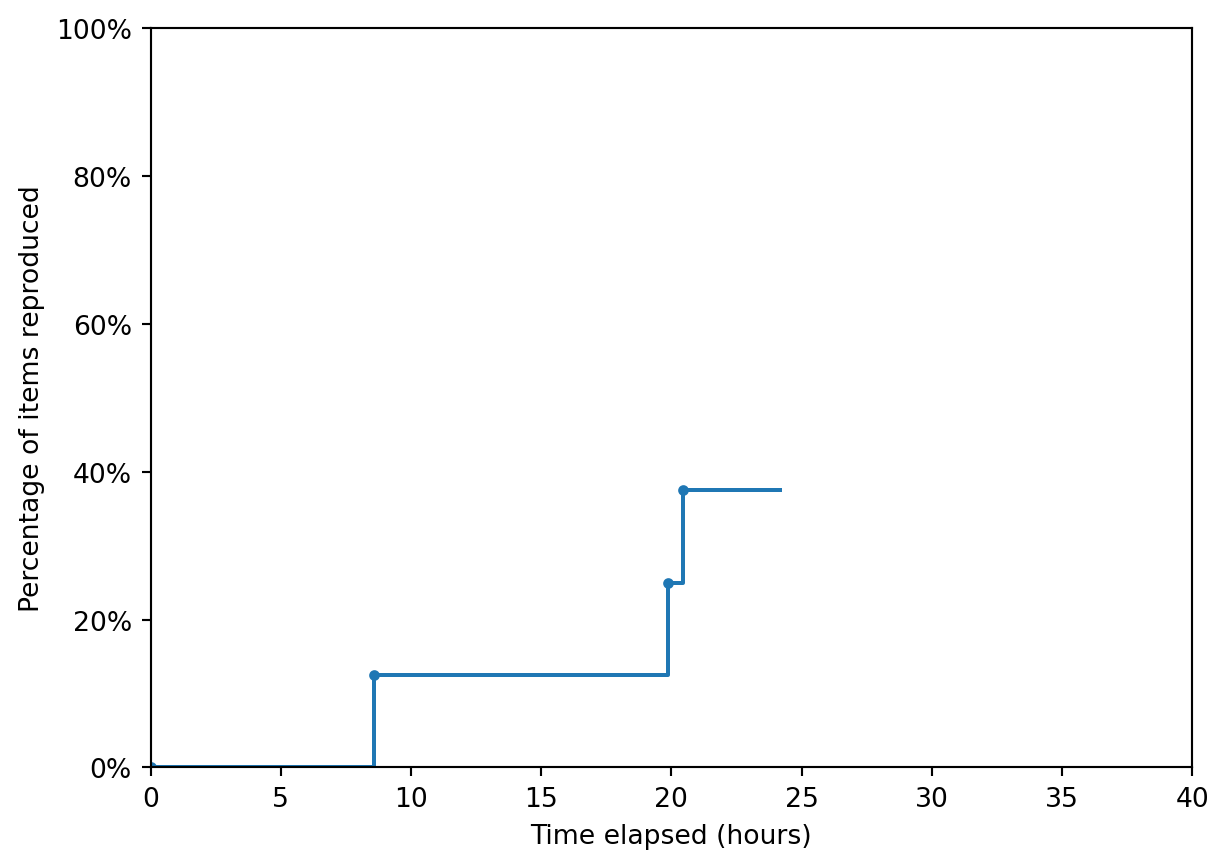
Of the 8 items in the scope, 37.5% (3 out of 8) were considered to be successfully reproduced.
As cited throughout, images on this page are sourced from Huang et al. (2019).
Time-to-completion
Non-interactive plot:
Interactive plot:
Reproduction of items from the scope
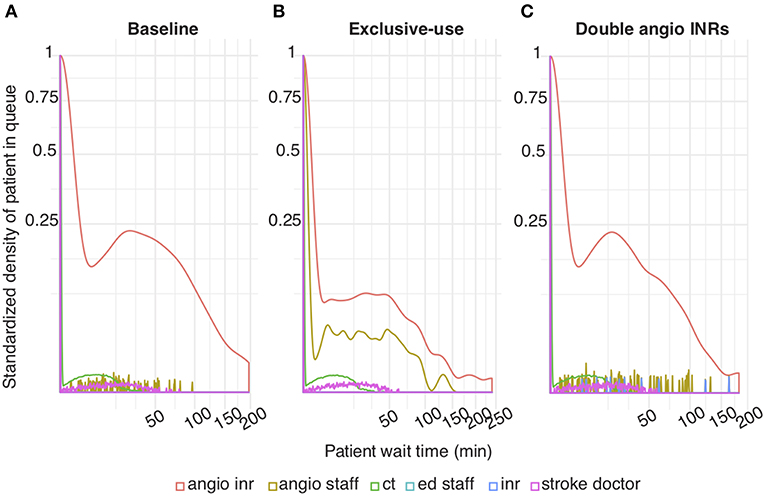
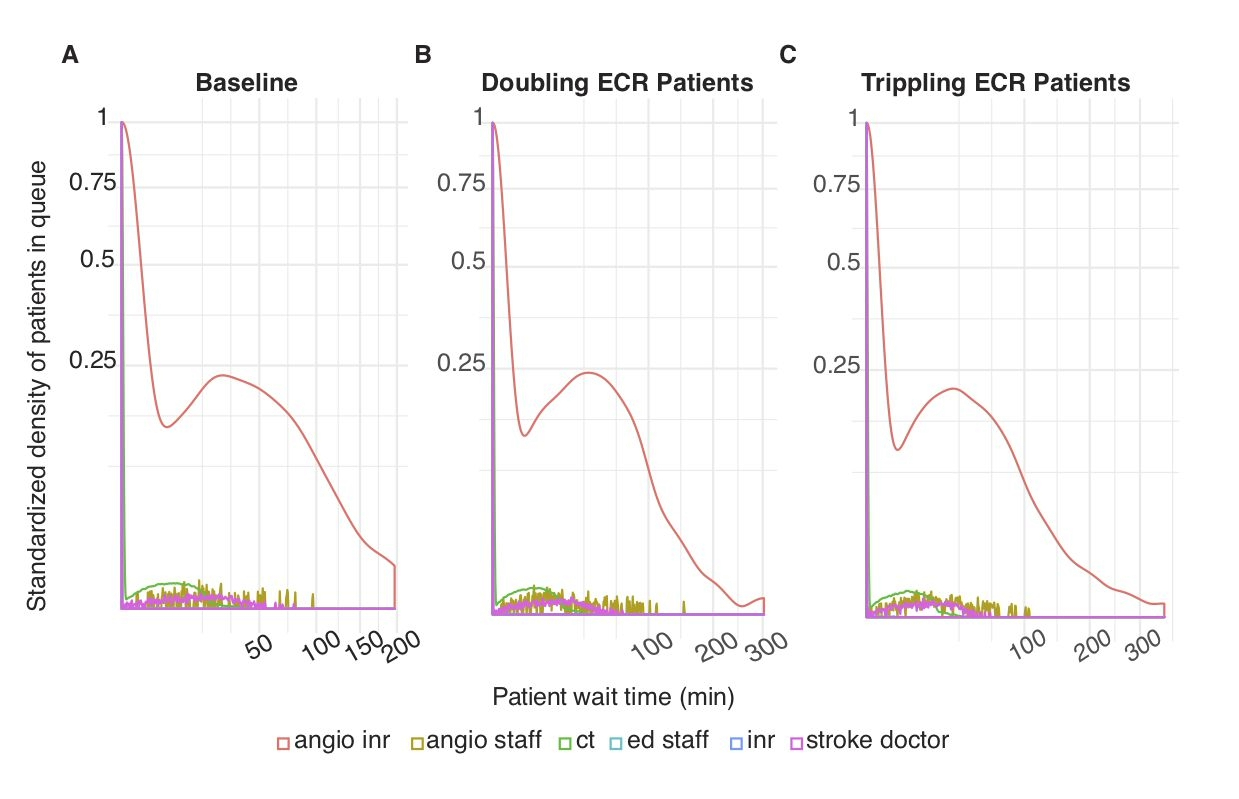
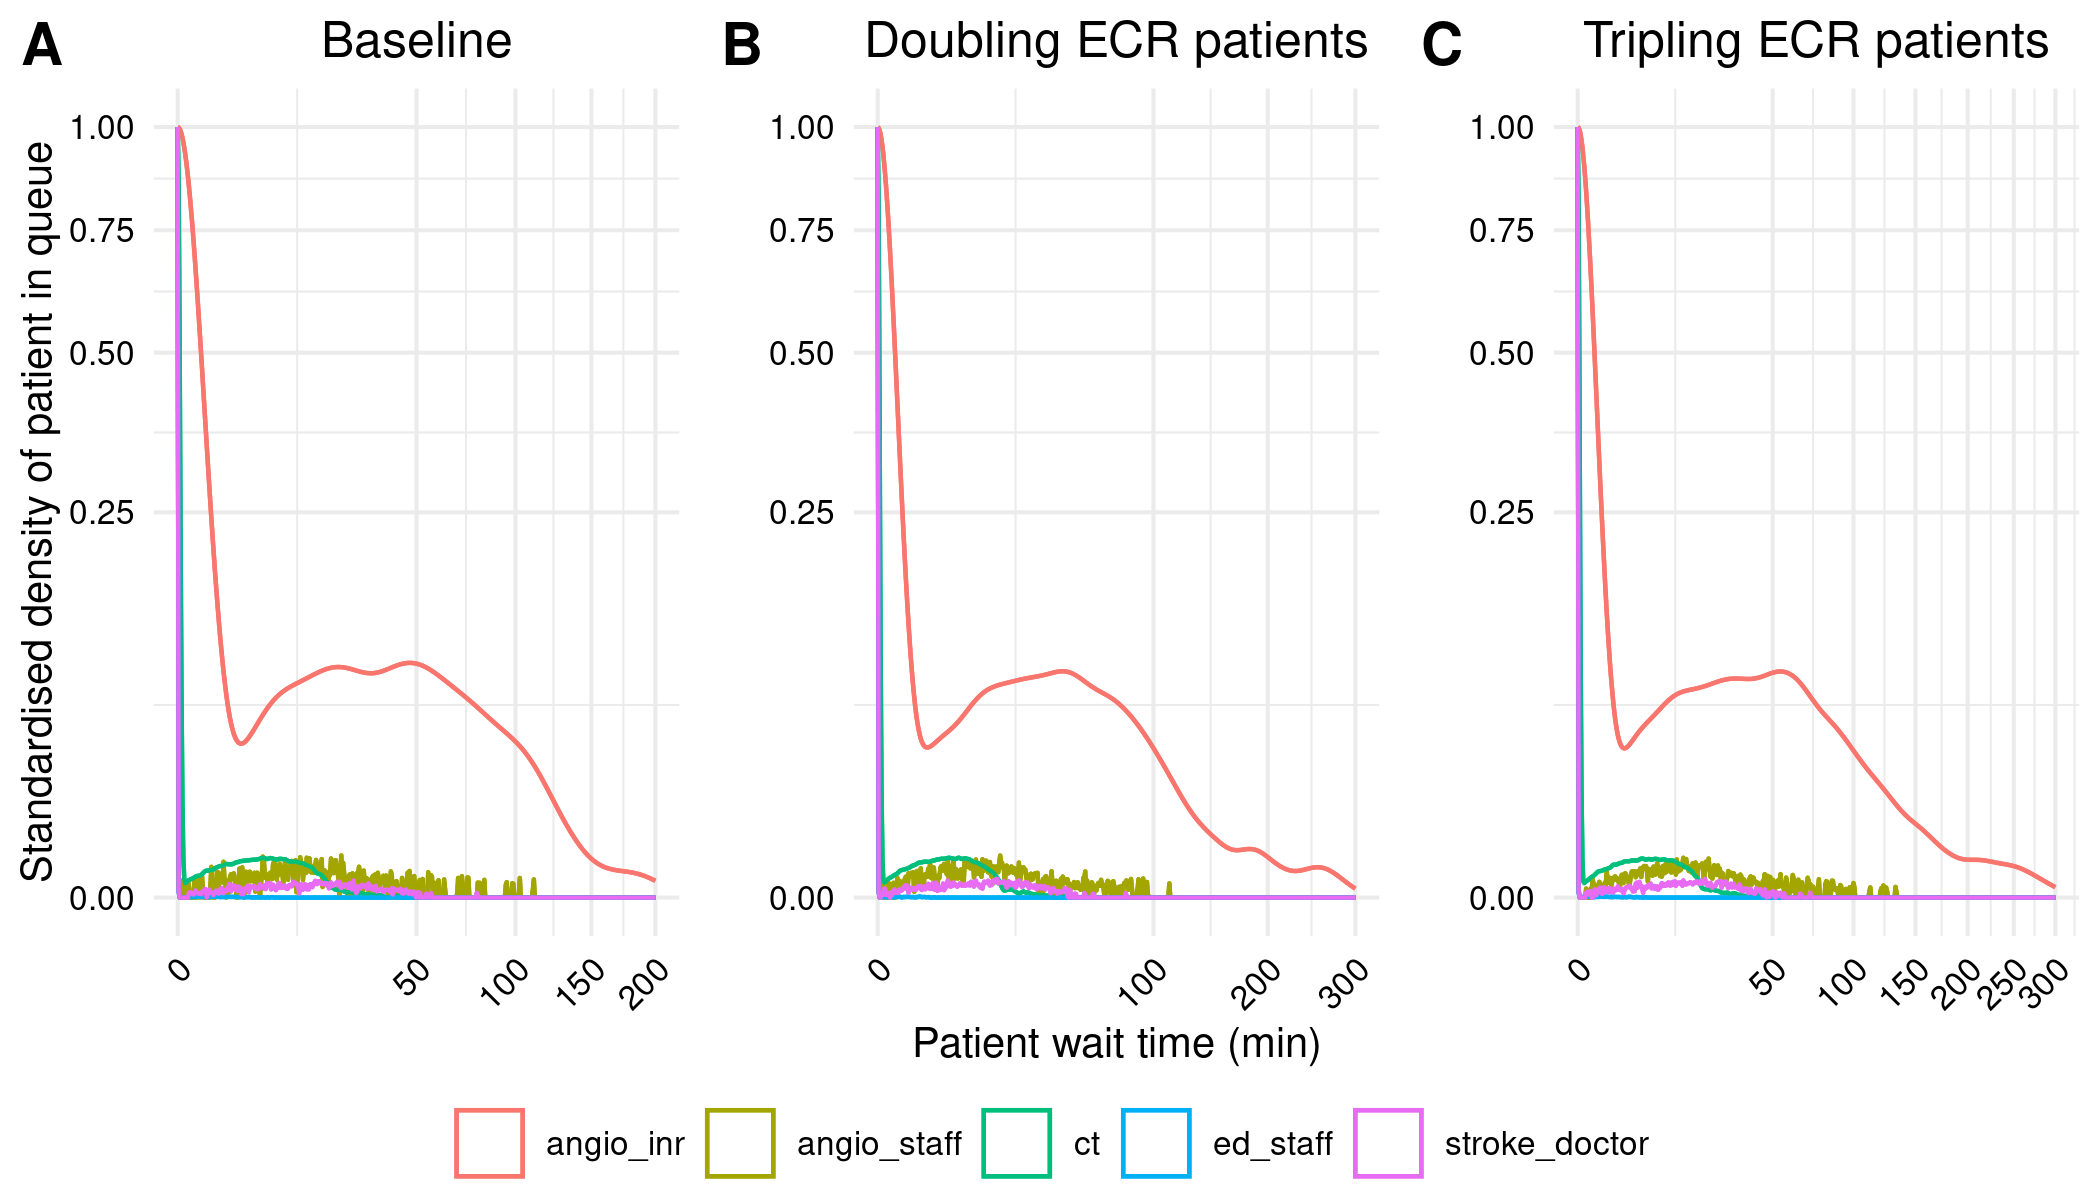
Figure 2
Consensus: Not reproduced
Original (Huang et al. (2019)):
Reproduction (angio_staff was hidden right behind inr, so have removed inr):
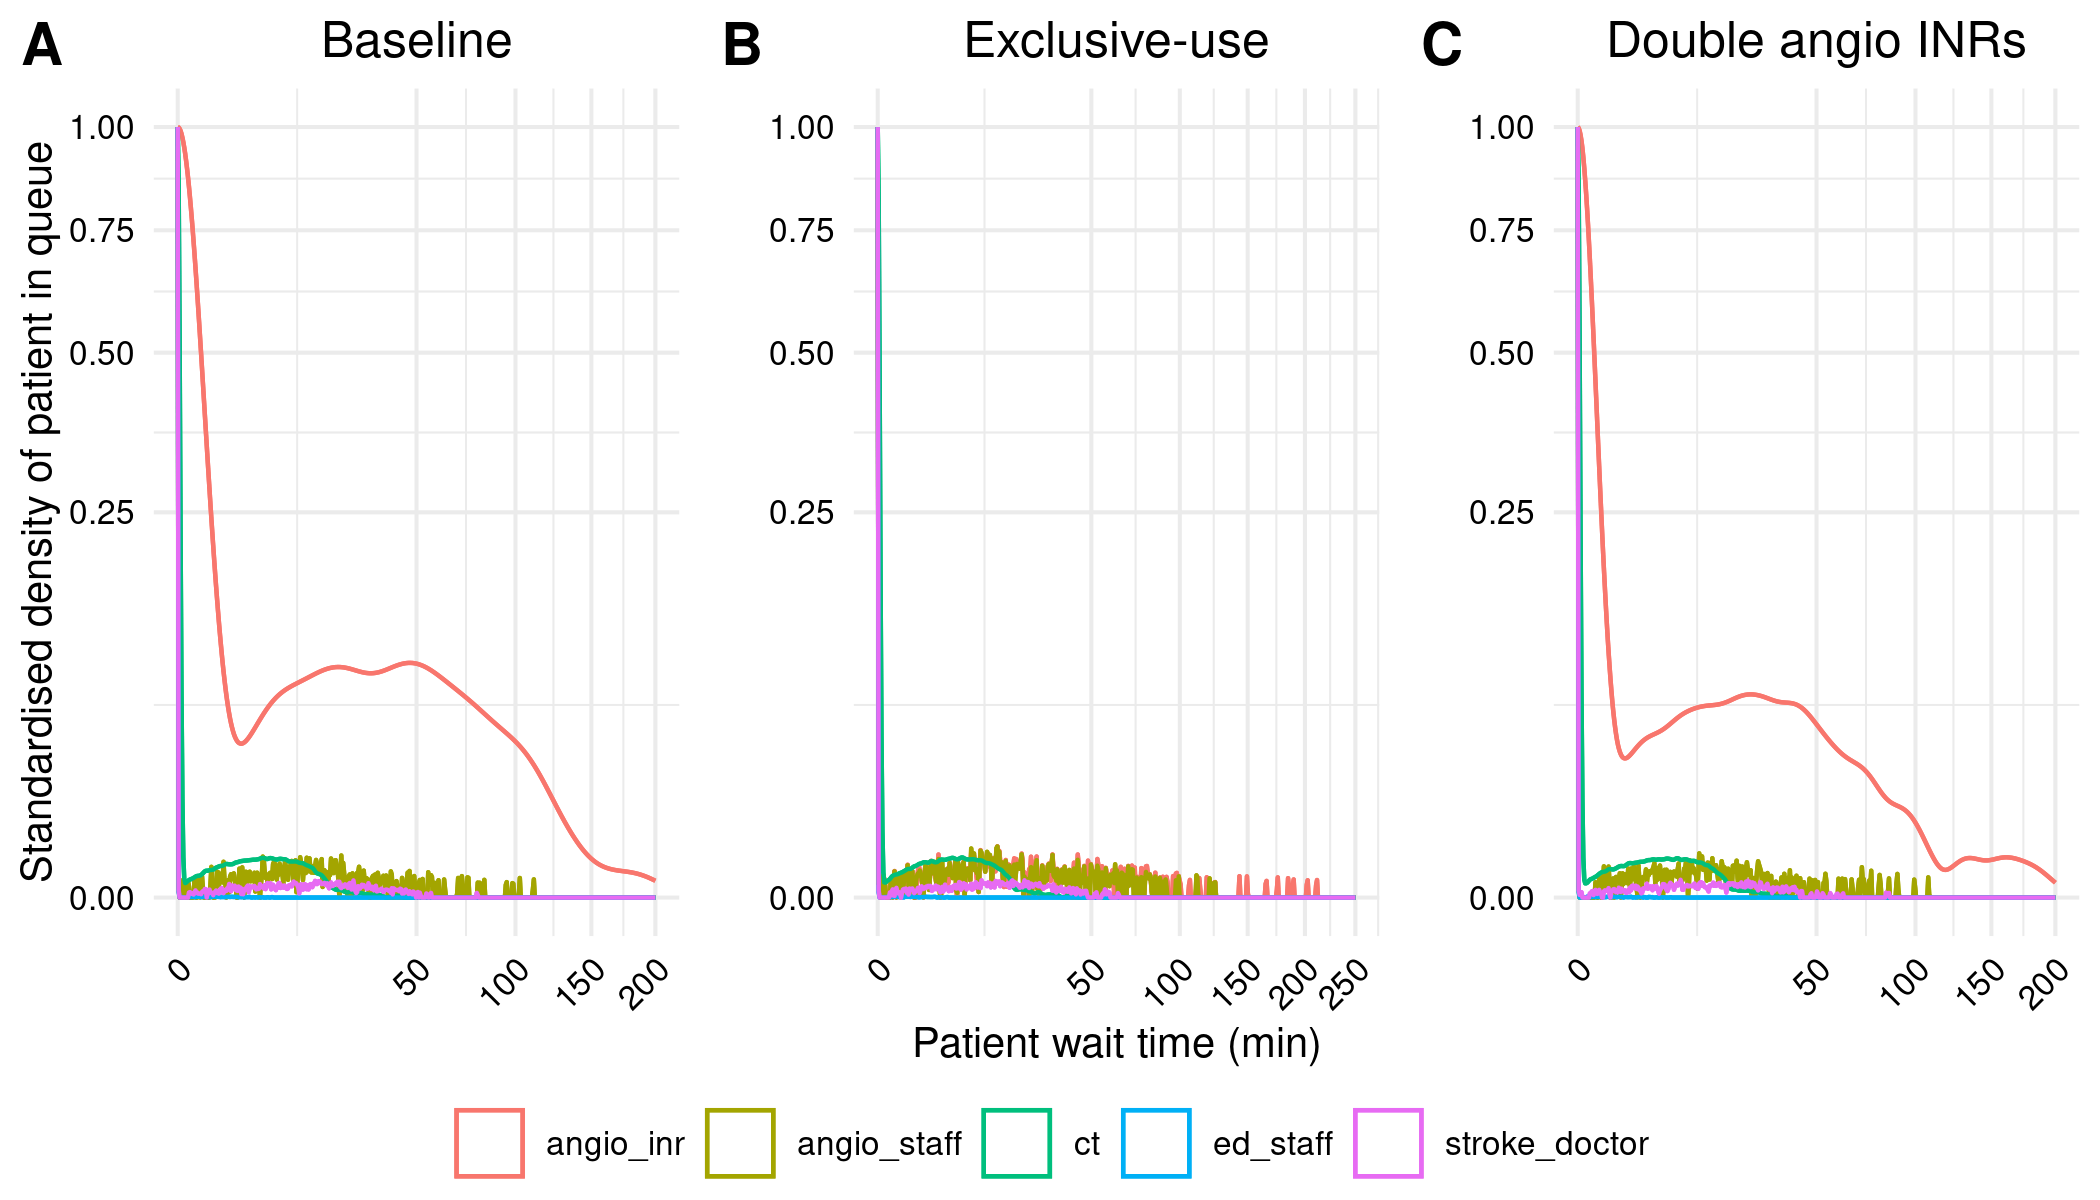
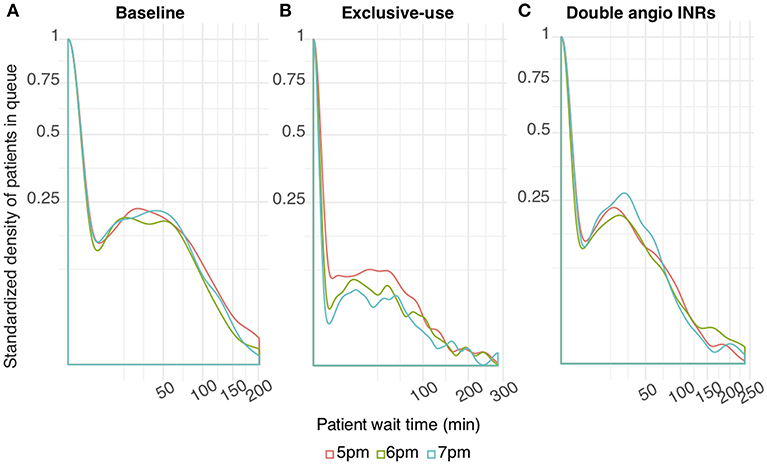
Figure 3
Consensus: Not reproduced
Original (Huang et al. (2019)):
Reproduction:
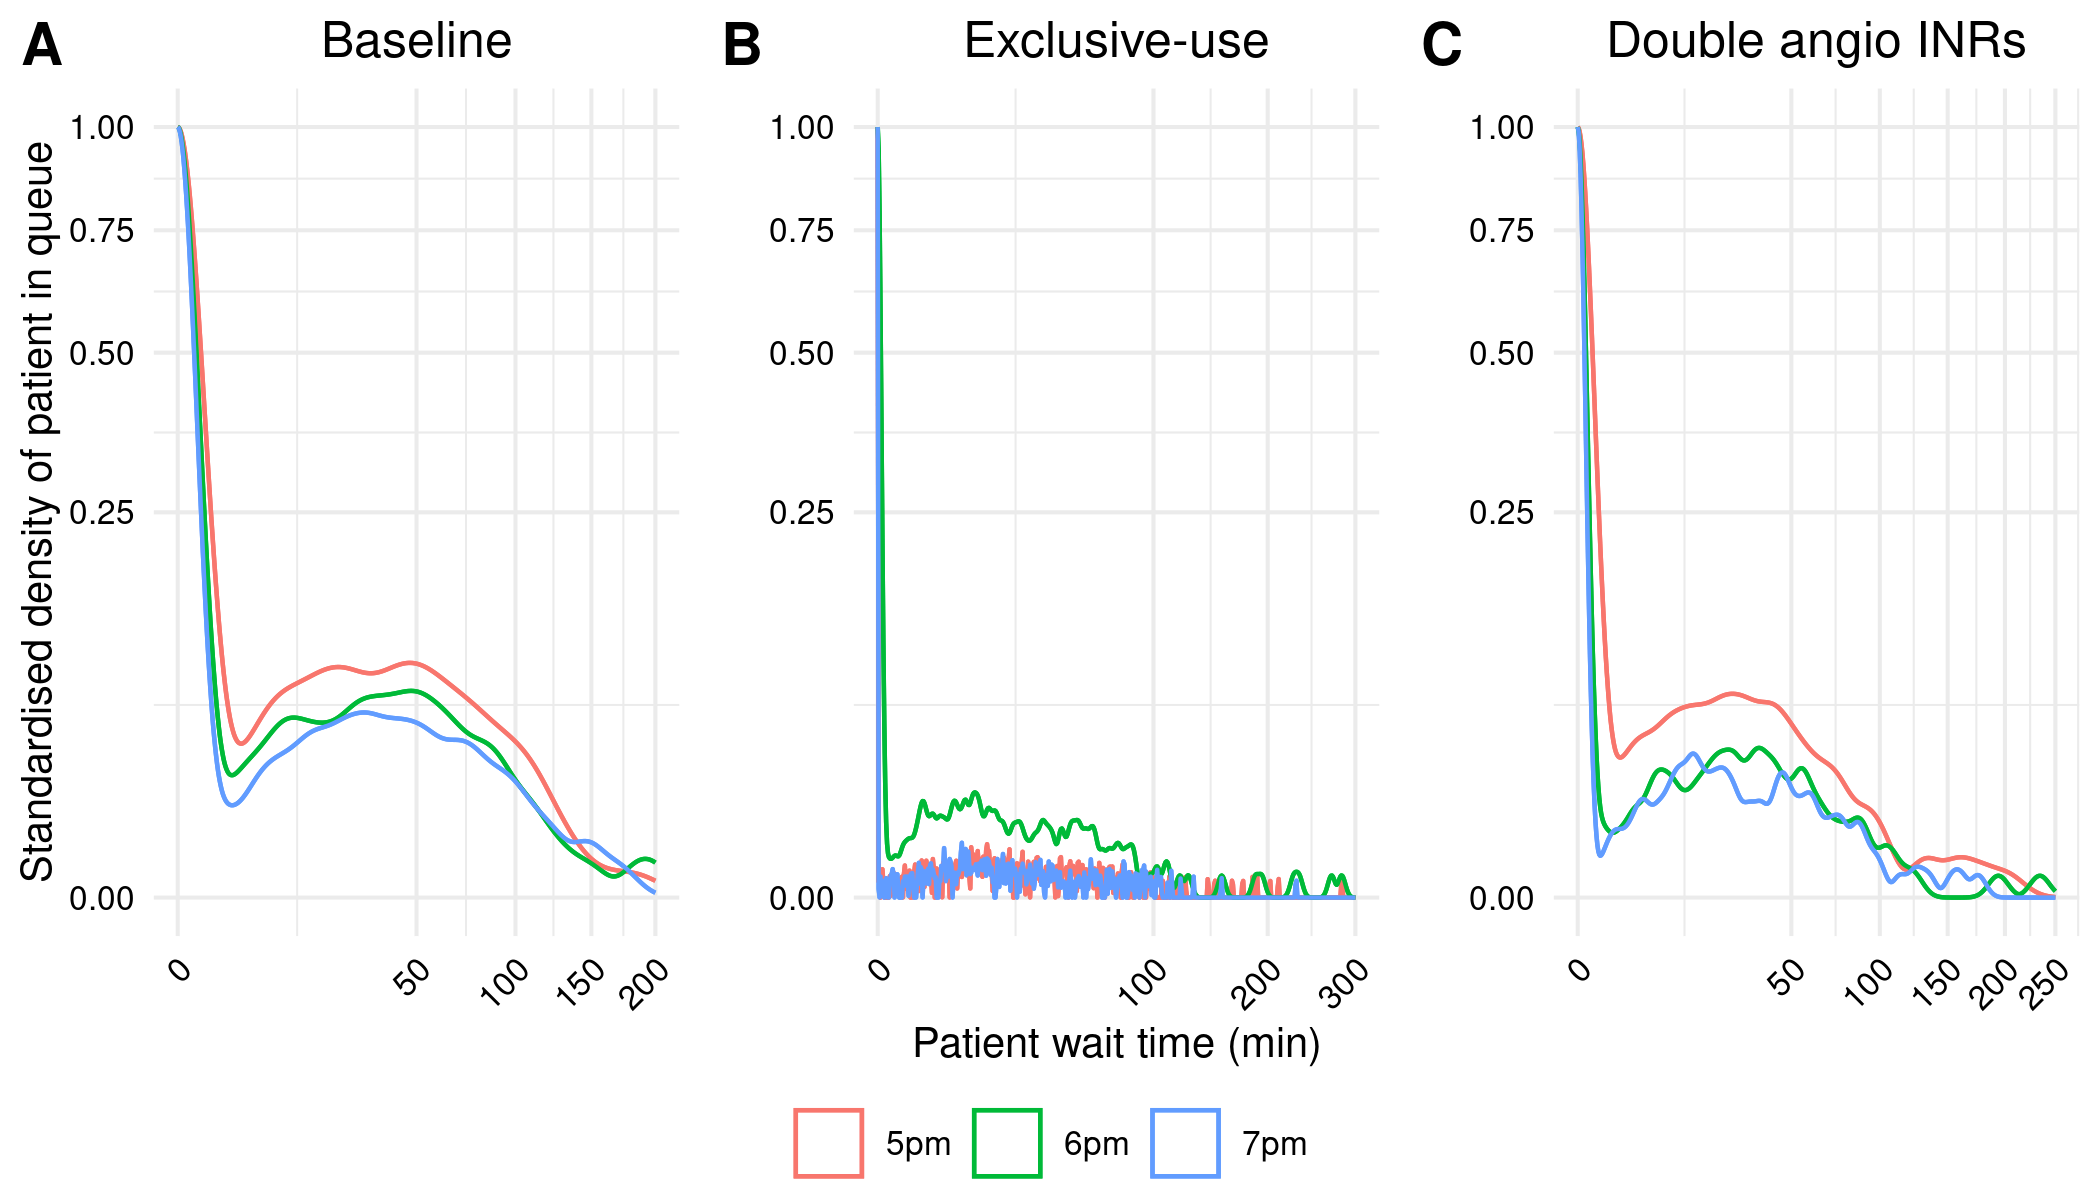
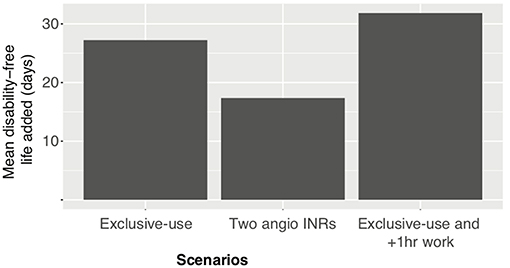
Figure 4
Consensus: Not reproduced
Original (Huang et al. (2019)):
Reproduction:
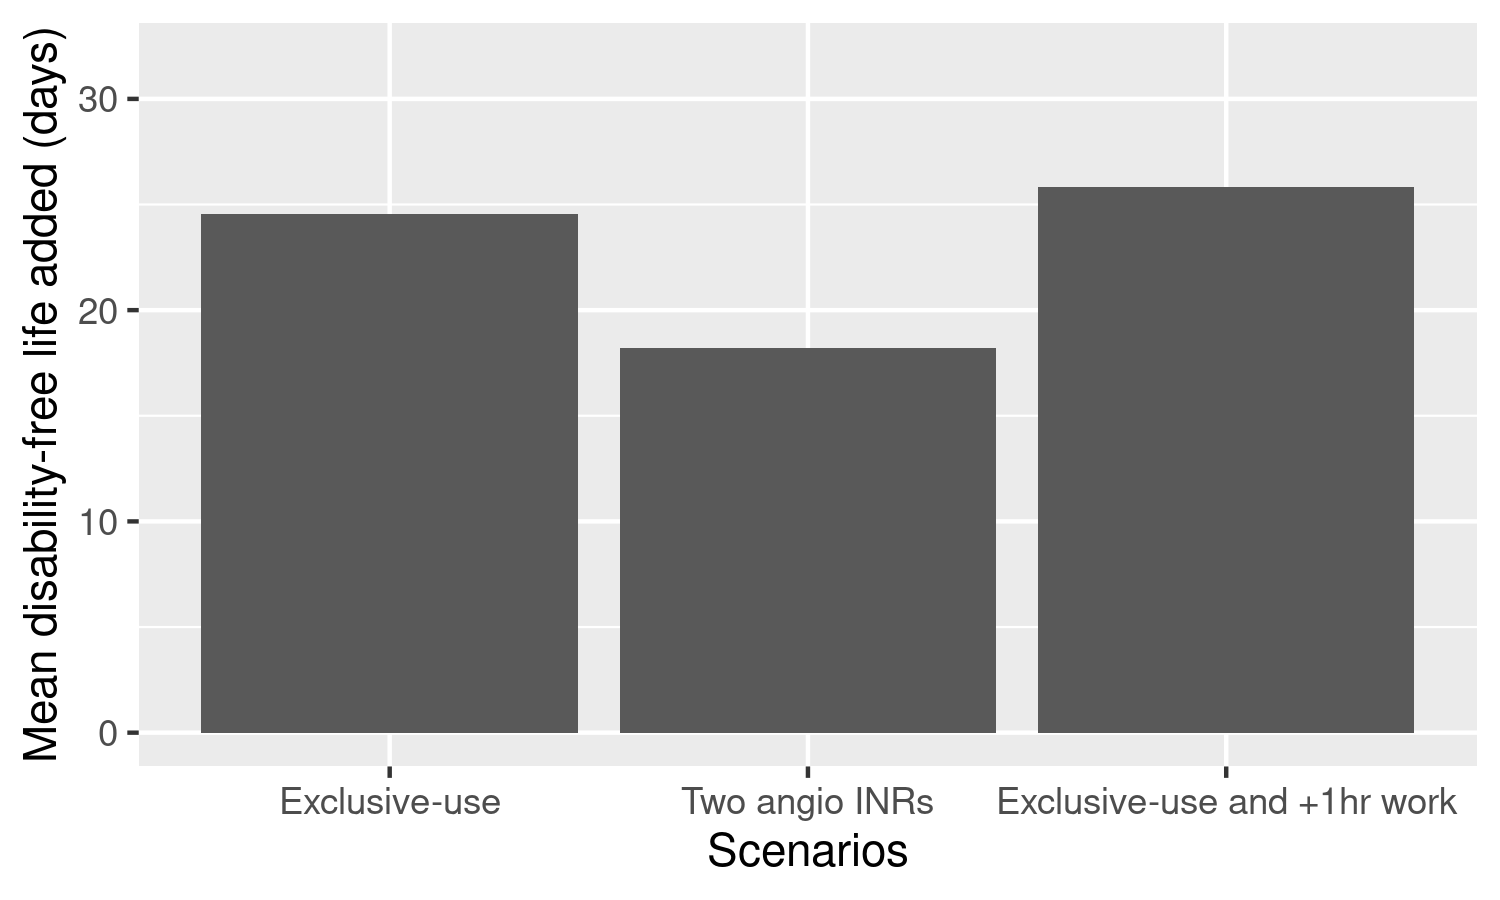
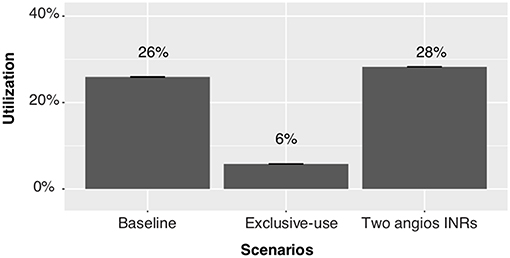
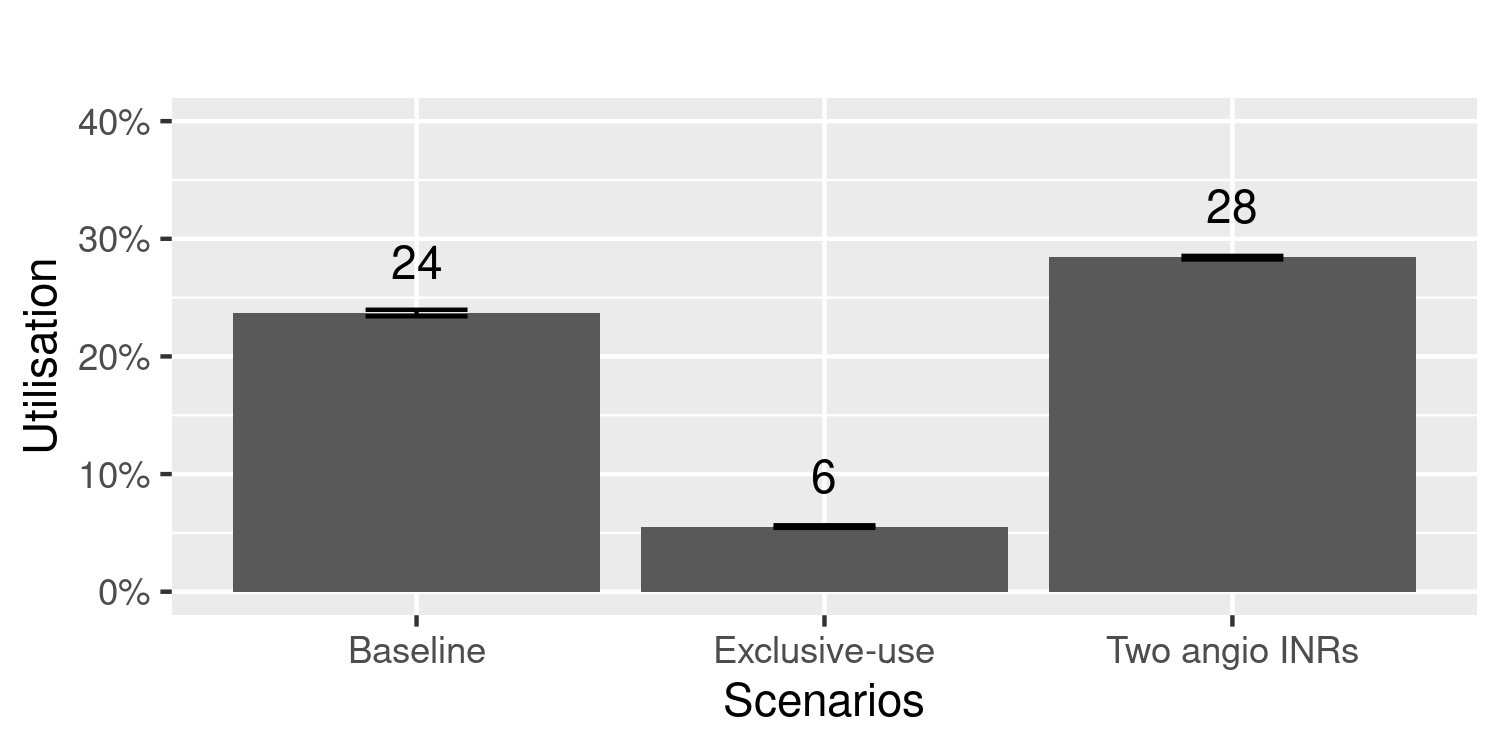
Figure 5
Consensus: Successfully reproduced
Original (Huang et al. (2019)):
Reproduction:
Supplementary figure
Consensus: Not reproduced
Original (Huang et al. (2019)):
Reproduction (angio_staff was hidden right behind inr, so have removed inr):
In-text result 1
Consensus: Successfully reproduced
“Exclusive-Use Scenario. In this scenario, the overall wait time probability at angioINR was reduced compared to baseline (red line in Figure 2B compared to Figure 2A). This represents a decrease in ECR patient wait time for angioINR by an average of 6 min.” Huang et al. (2019)
Reproduction:
| scenario | mean | diff_from_baseline | |
|---|---|---|---|
| 0 | Baseline | 13.958269 | 0.00 |
| 1 | Exclusive use | 8.117729 | -5.84 |
In-text result 2
Consensus: Successfully reproduced
“Two angioINRs Scenario. This scenario simulates the effect a facility upgrade to two biplane angiographic suites, but without additional staff changes. The wait time probability at angioINR was reduced compared to baseline (Figure 2C). The reduction represents an average of 4 min less in queue for angioINR.” Huang et al. (2019)
Reproduction:
| scenario | mean | diff_from_baseline | |
|---|---|---|---|
| 0 | Baseline | 13.958269 | 0.00 |
| 2 | Two AngioINRs | 9.621122 | -4.34 |
In-text result 3
Consensus: Not reproduced
“Extended Schedule Scenario. The wait time probability at angioINR in the exclusive- use scenario was further reduced by extended work hours (Figure 3B). In contrast, work extension did not affect baseline or the 2 angioINRs scenario (Figures 3A,C). For the baseline scenario, 1 and 2 h of extra work resulted in an average wait time of 1.7 and 0.9 min reduction, respectively. For the 2 angioINRs scenario, 1 and 2 h of extra work resulted in an average wait time gain of 1 and 0.3 min, respectively.” Huang et al. (2019)
Reproduction:
| scenario | shift | mean | diff_from_5pm | |
|---|---|---|---|---|
| 0 | Baseline | 5pm | 13.958269 | 0.00 |
| 1 | Baseline | 6pm | 12.486042 | -1.47 |
| 2 | Baseline | 7pm | 12.491421 | -1.47 |
| 6 | Two AngioINRs | 5pm | 9.621122 | 0.00 |
| 7 | Two AngioINRs | 6pm | 9.216435 | -0.40 |
| 8 | Two AngioINRs | 7pm | 8.699223 | -0.92 |
References
Huang, Shiwei, Julian Maingard, Hong Kuan Kok, Christen D. Barras, Vincent Thijs, Ronil V. Chandra, Duncan Mark Brooks, and Hamed Asadi. 2019. “Optimizing Resources for Endovascular Clot Retrieval for Acute Ischemic Stroke, a Discrete Event Simulation.” Frontiers in Neurology 10 (June). https://doi.org/10.3389/fneur.2019.00653.