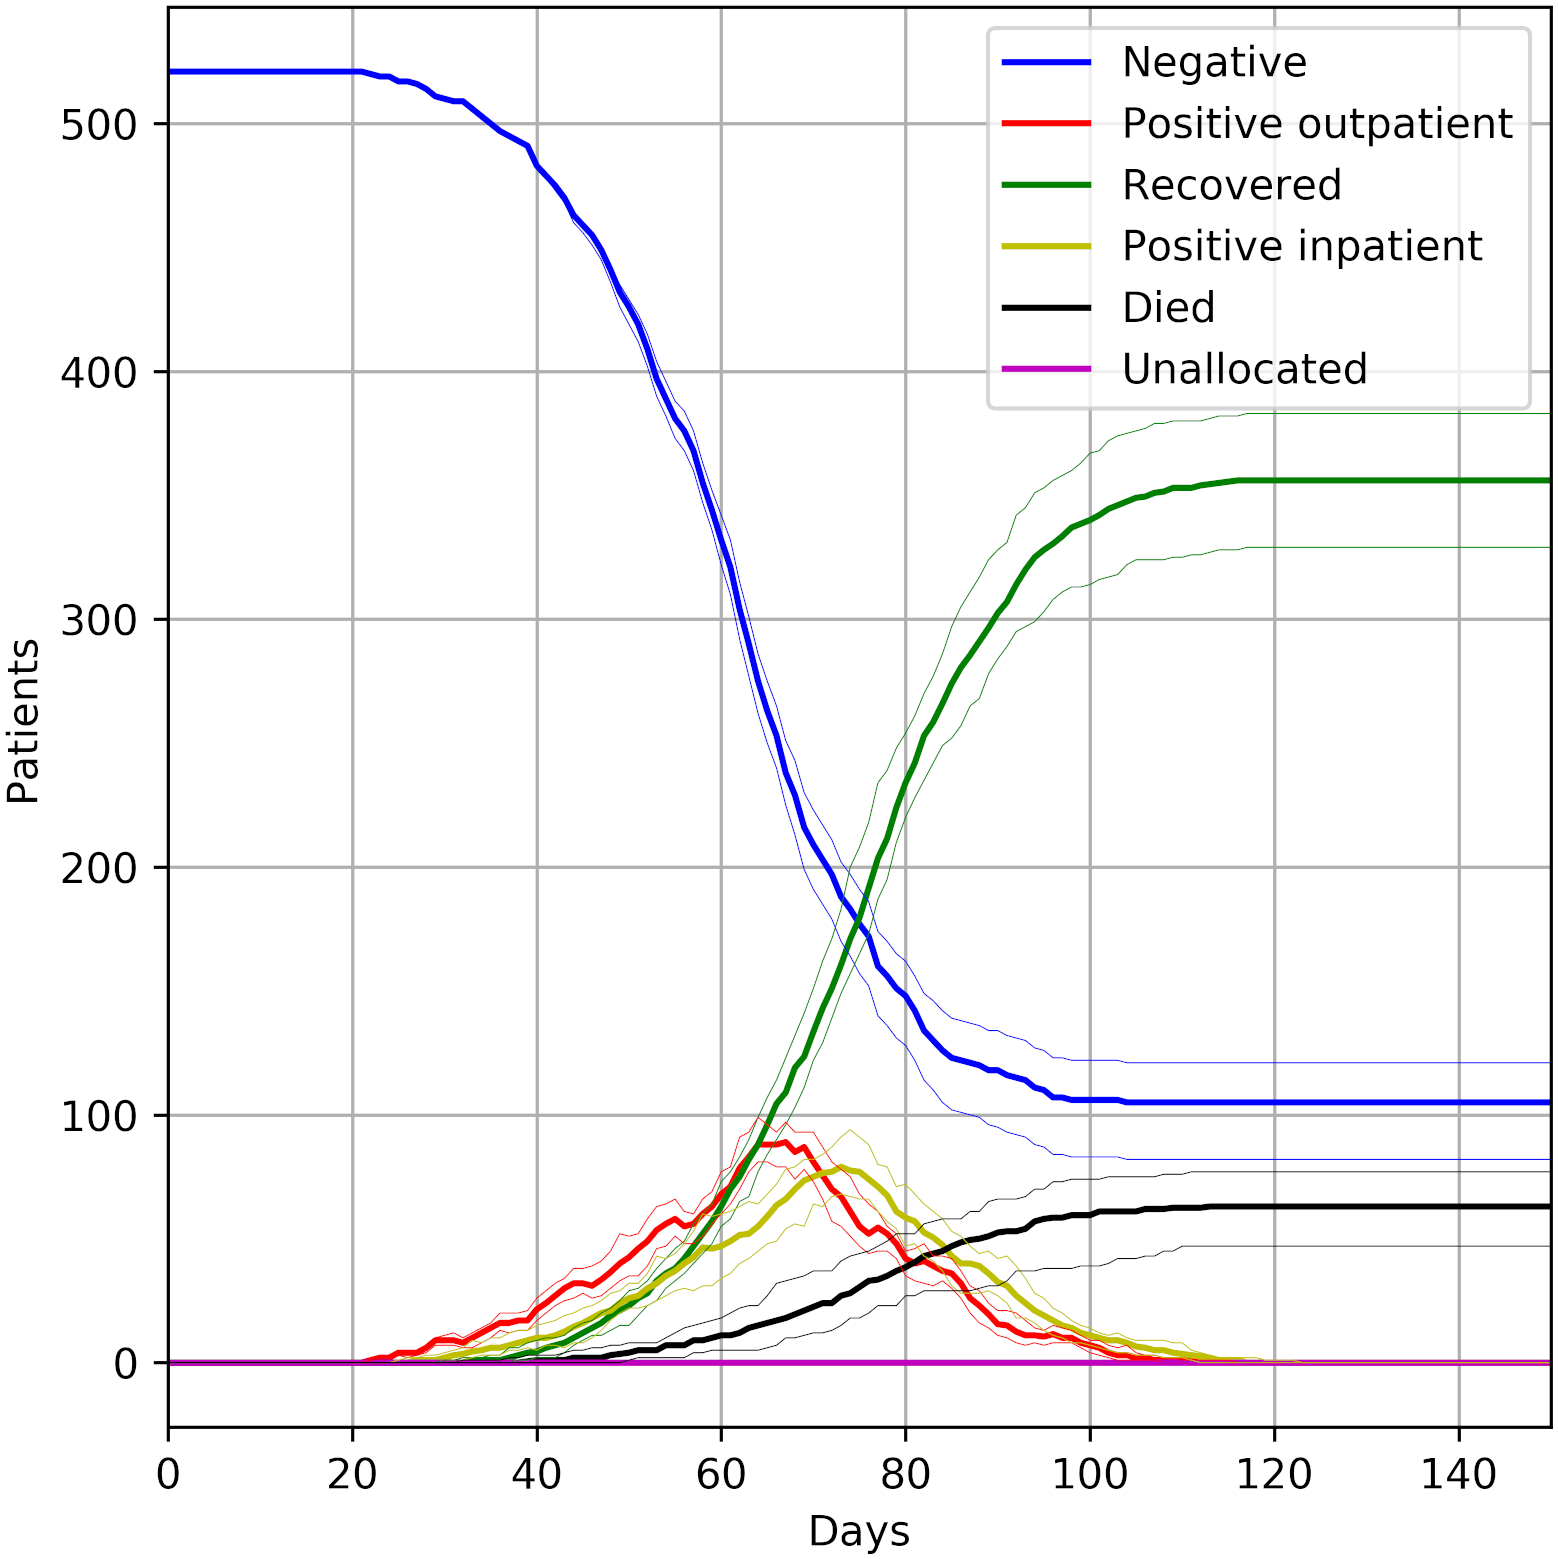
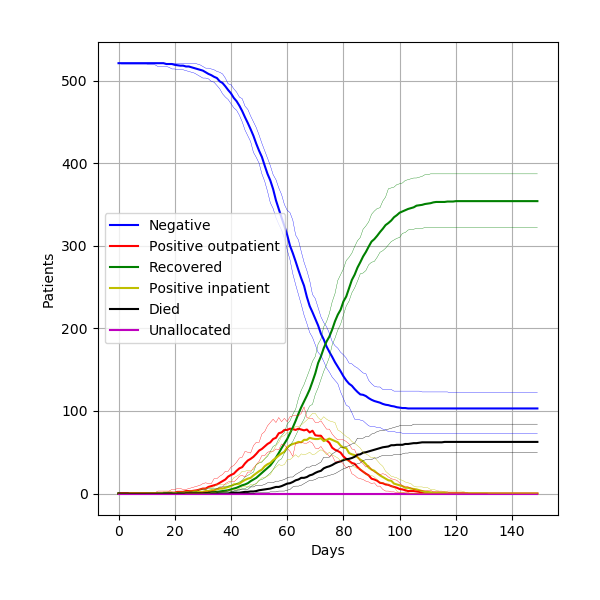
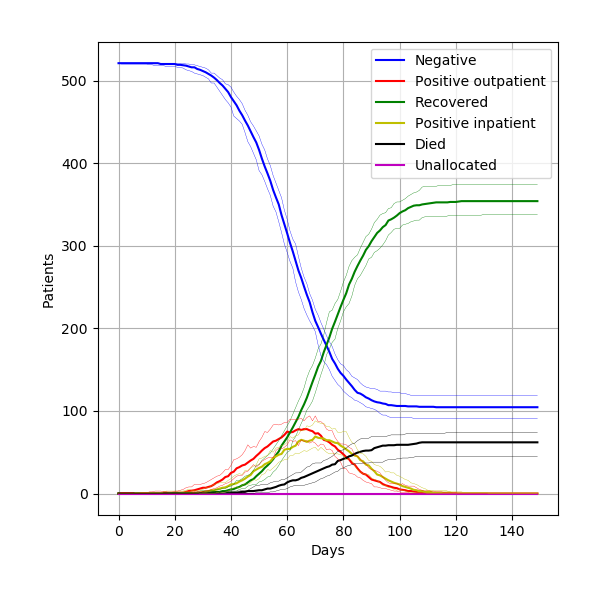
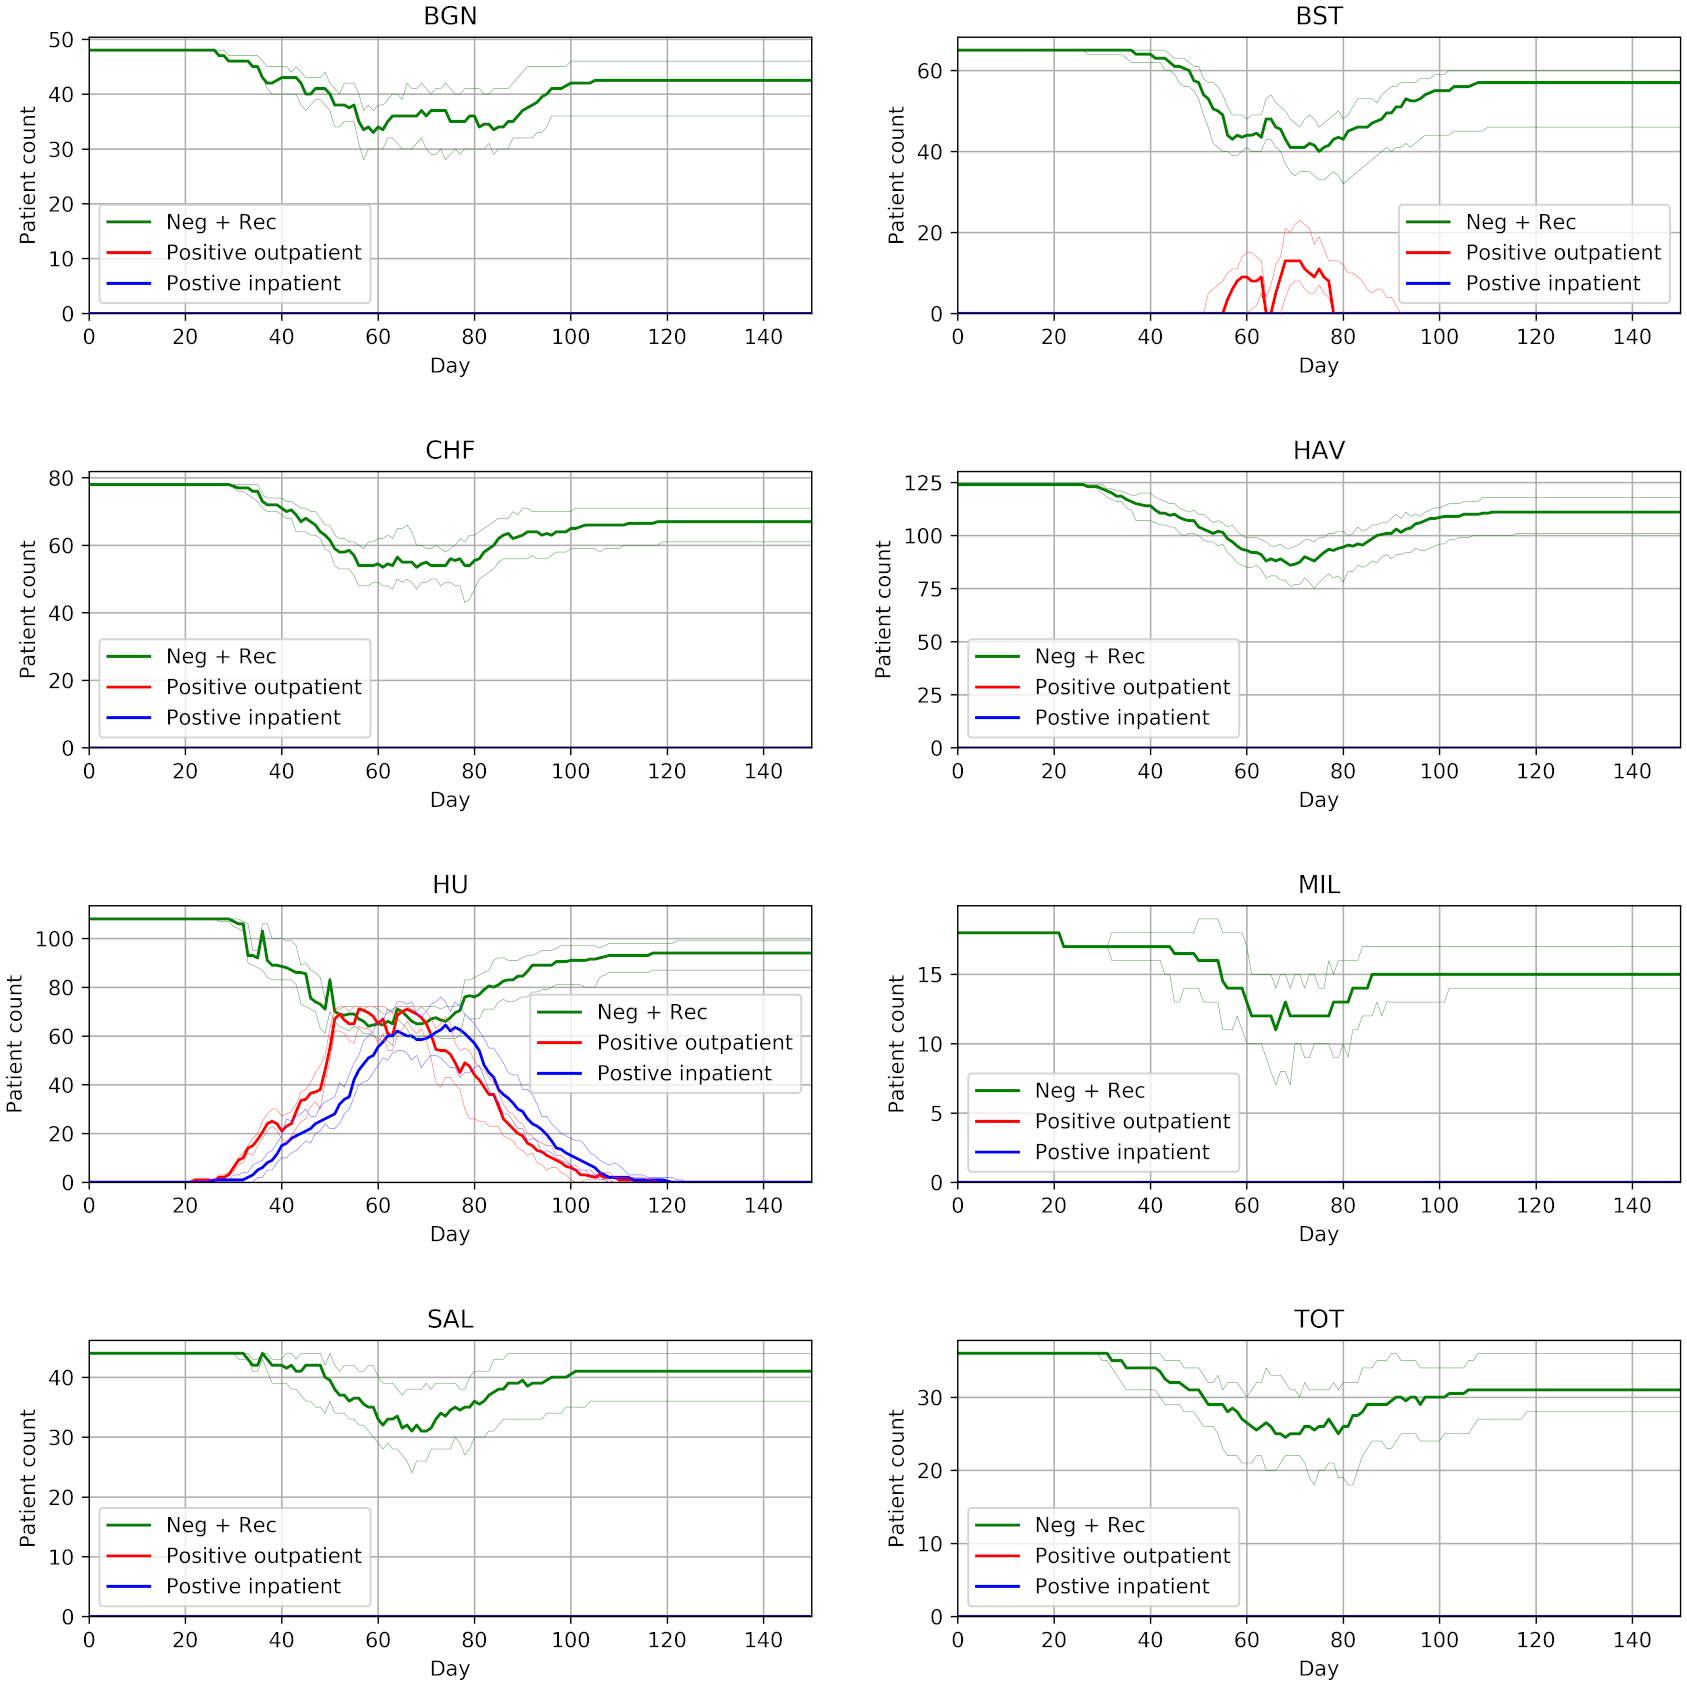
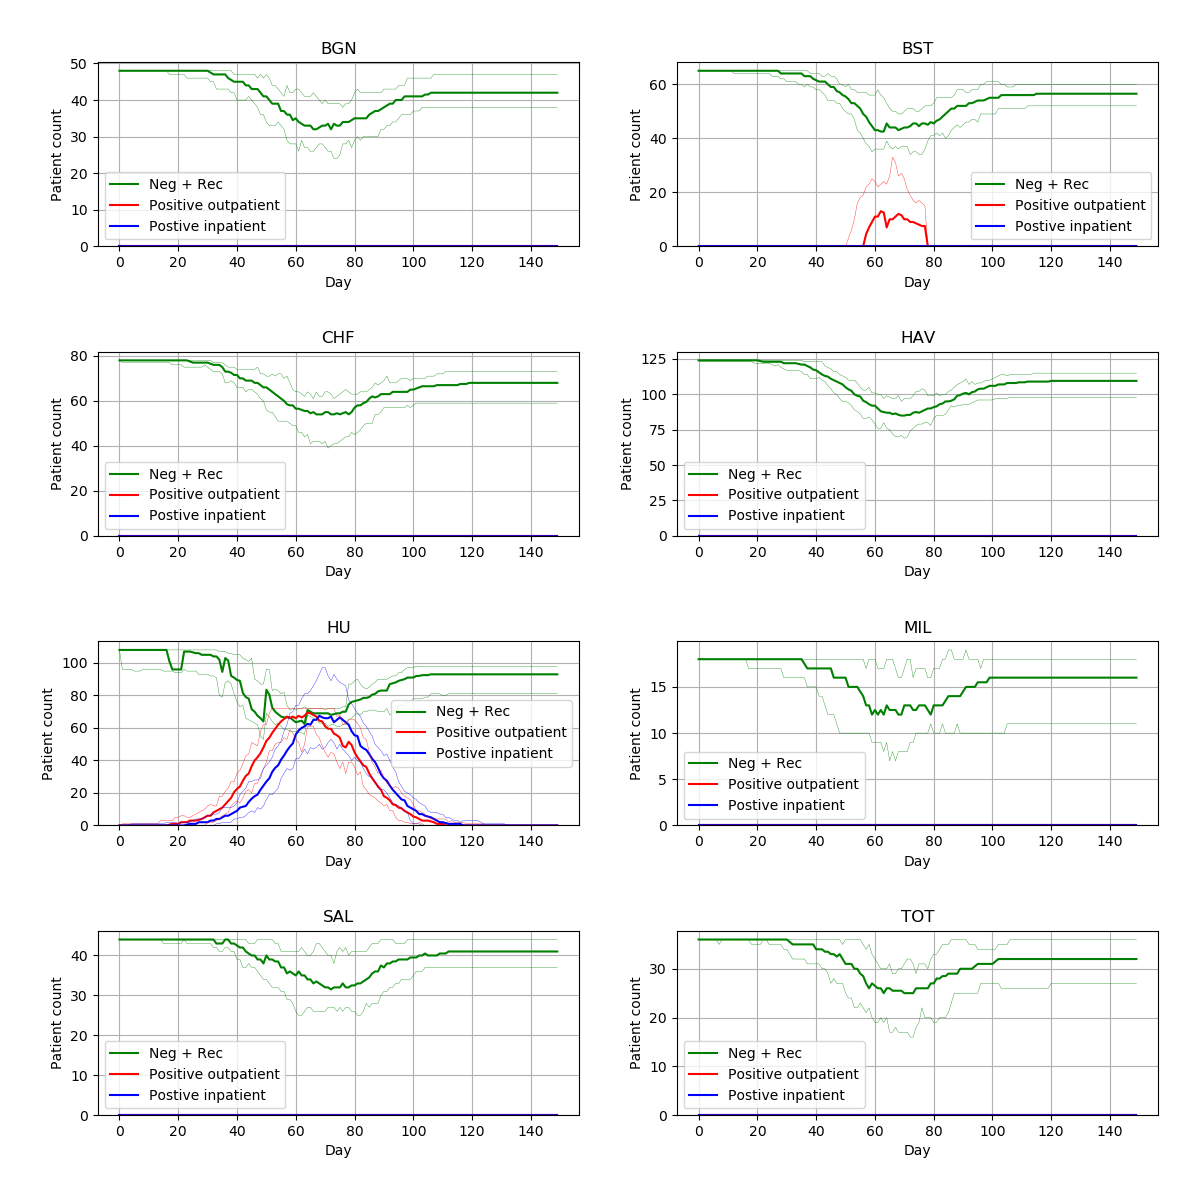
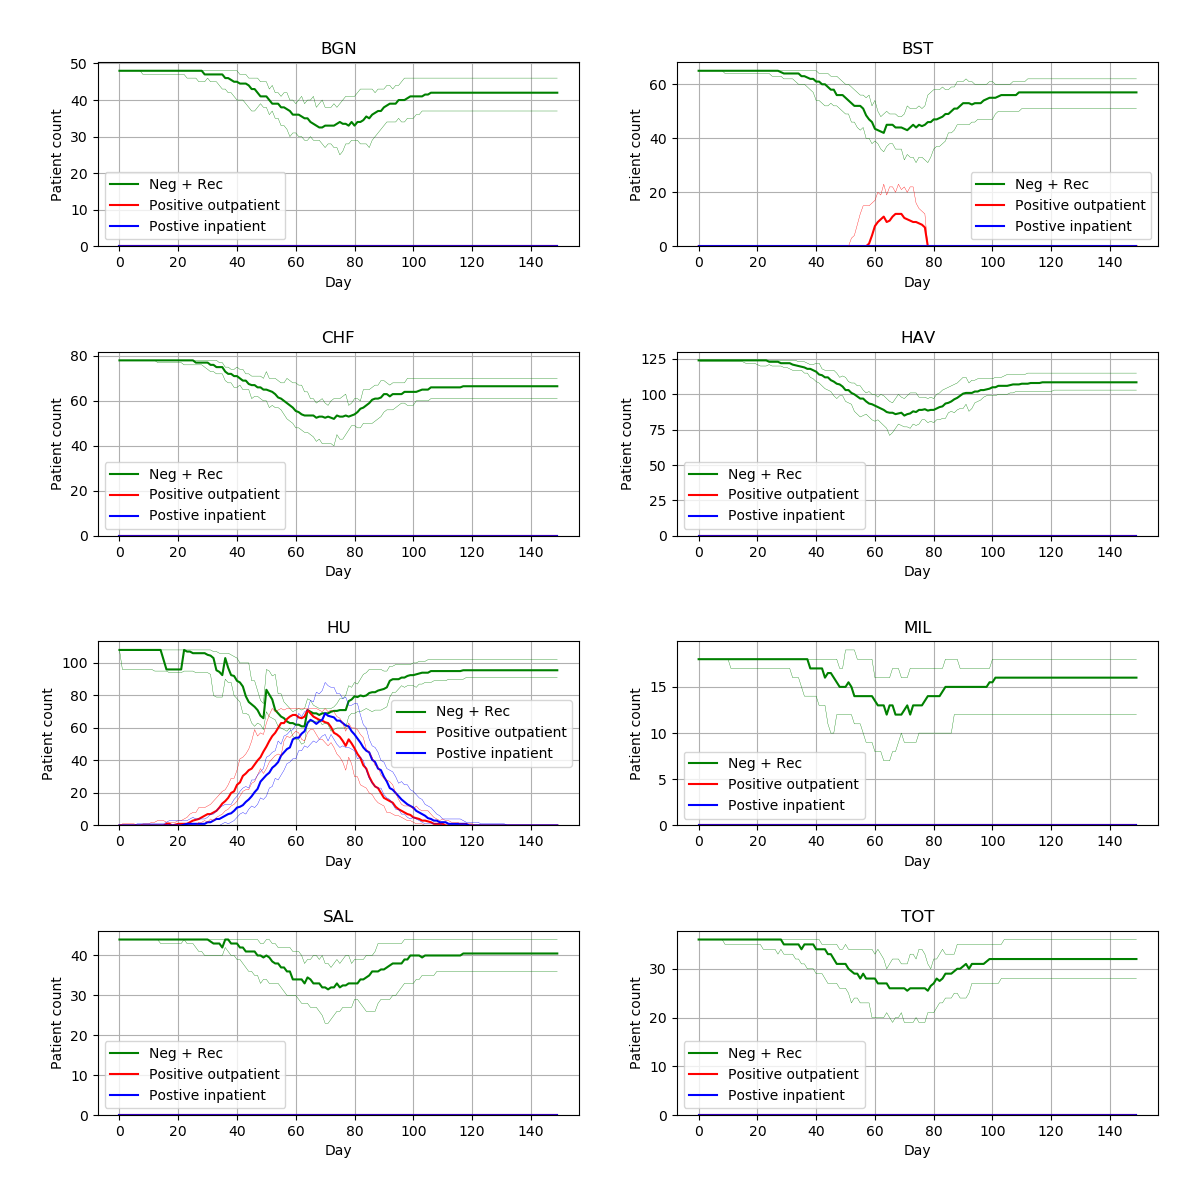
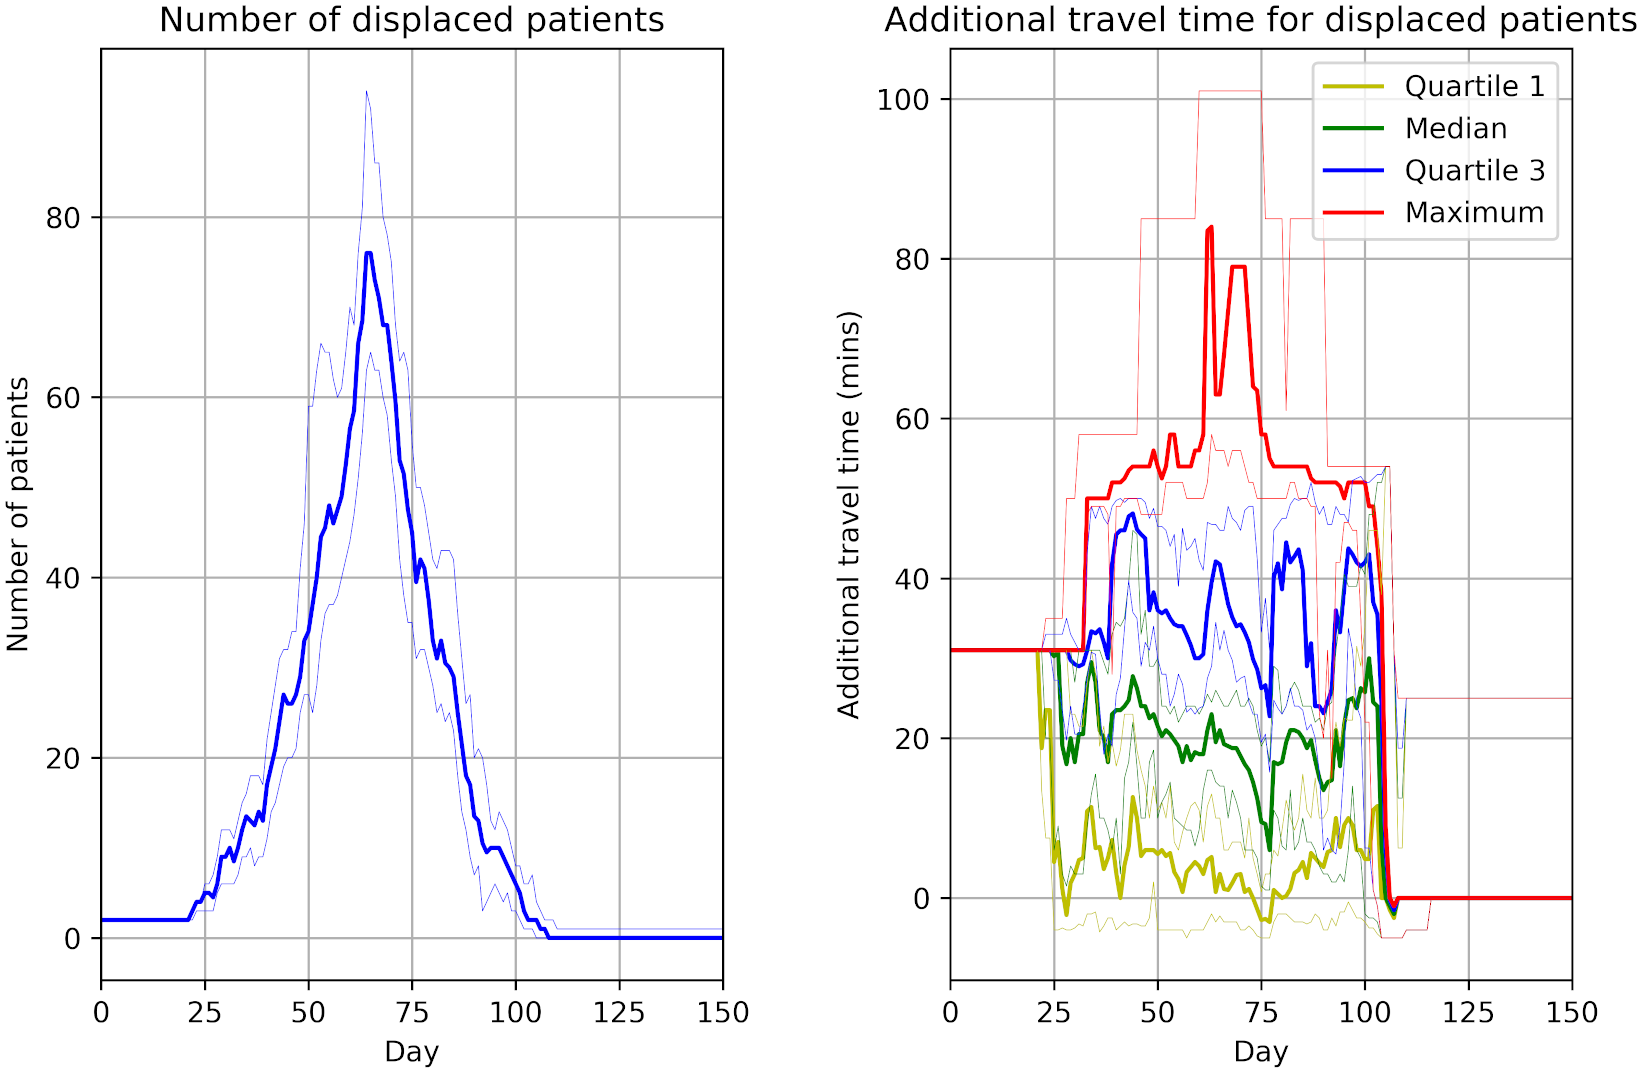
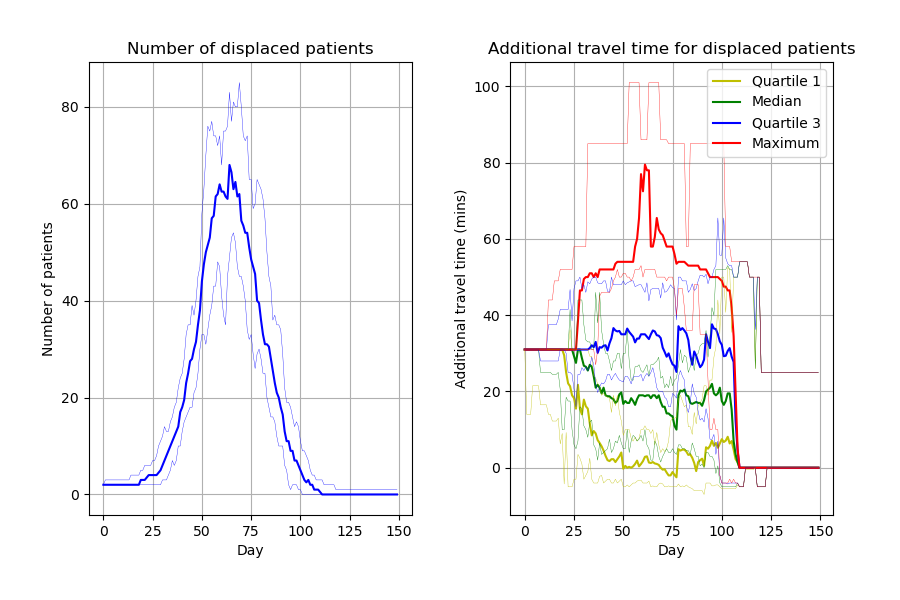
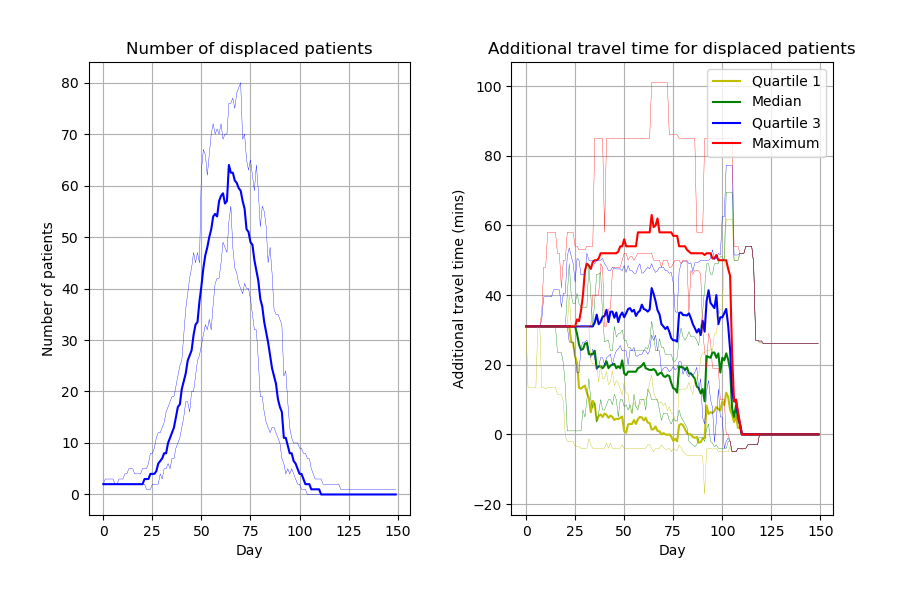
From 15 different versions, I’m finding the peaks of the figures from the paper to be slightly higher than typical. Assuming that model parameters are correct and that control of randomness is now implemented appropriately, this highlights the relevance of simulation stability. Although 30 replications were performed, there was not assessment of whether this was the number needed for stability of results. This might be relevant to consider for STARS framework.
As in ‘Simulation: The Practice of Model Development and Use’ by Stewart Robinson, there are three approaches for selecting the number of replications:
- Rule of thumb - Law and McComas (1990) suggest at least 3-5, although models will often need more than that
- Graphical method - Plot cumulative mean of an output in a graph (X axis is replication number, and Y axis is cumulative mean), and identify when that line becomes flat
- Confidence interval method (recommended method) - Similar to above, but including confidence intervals in the plot (e.g. 95%), and basing decision on narrowness of these itnervals. This can be done by calculating the percentage deviations of the confidence interval on each side of the mean with the increasing number of replications. You then set a threshold of the amount of deviation desired.
