This page outlines the parts of the journal article which we will attempt to reproduce.
All images and quotes on this page are sourced from Kim et al. (2021)
Within scope
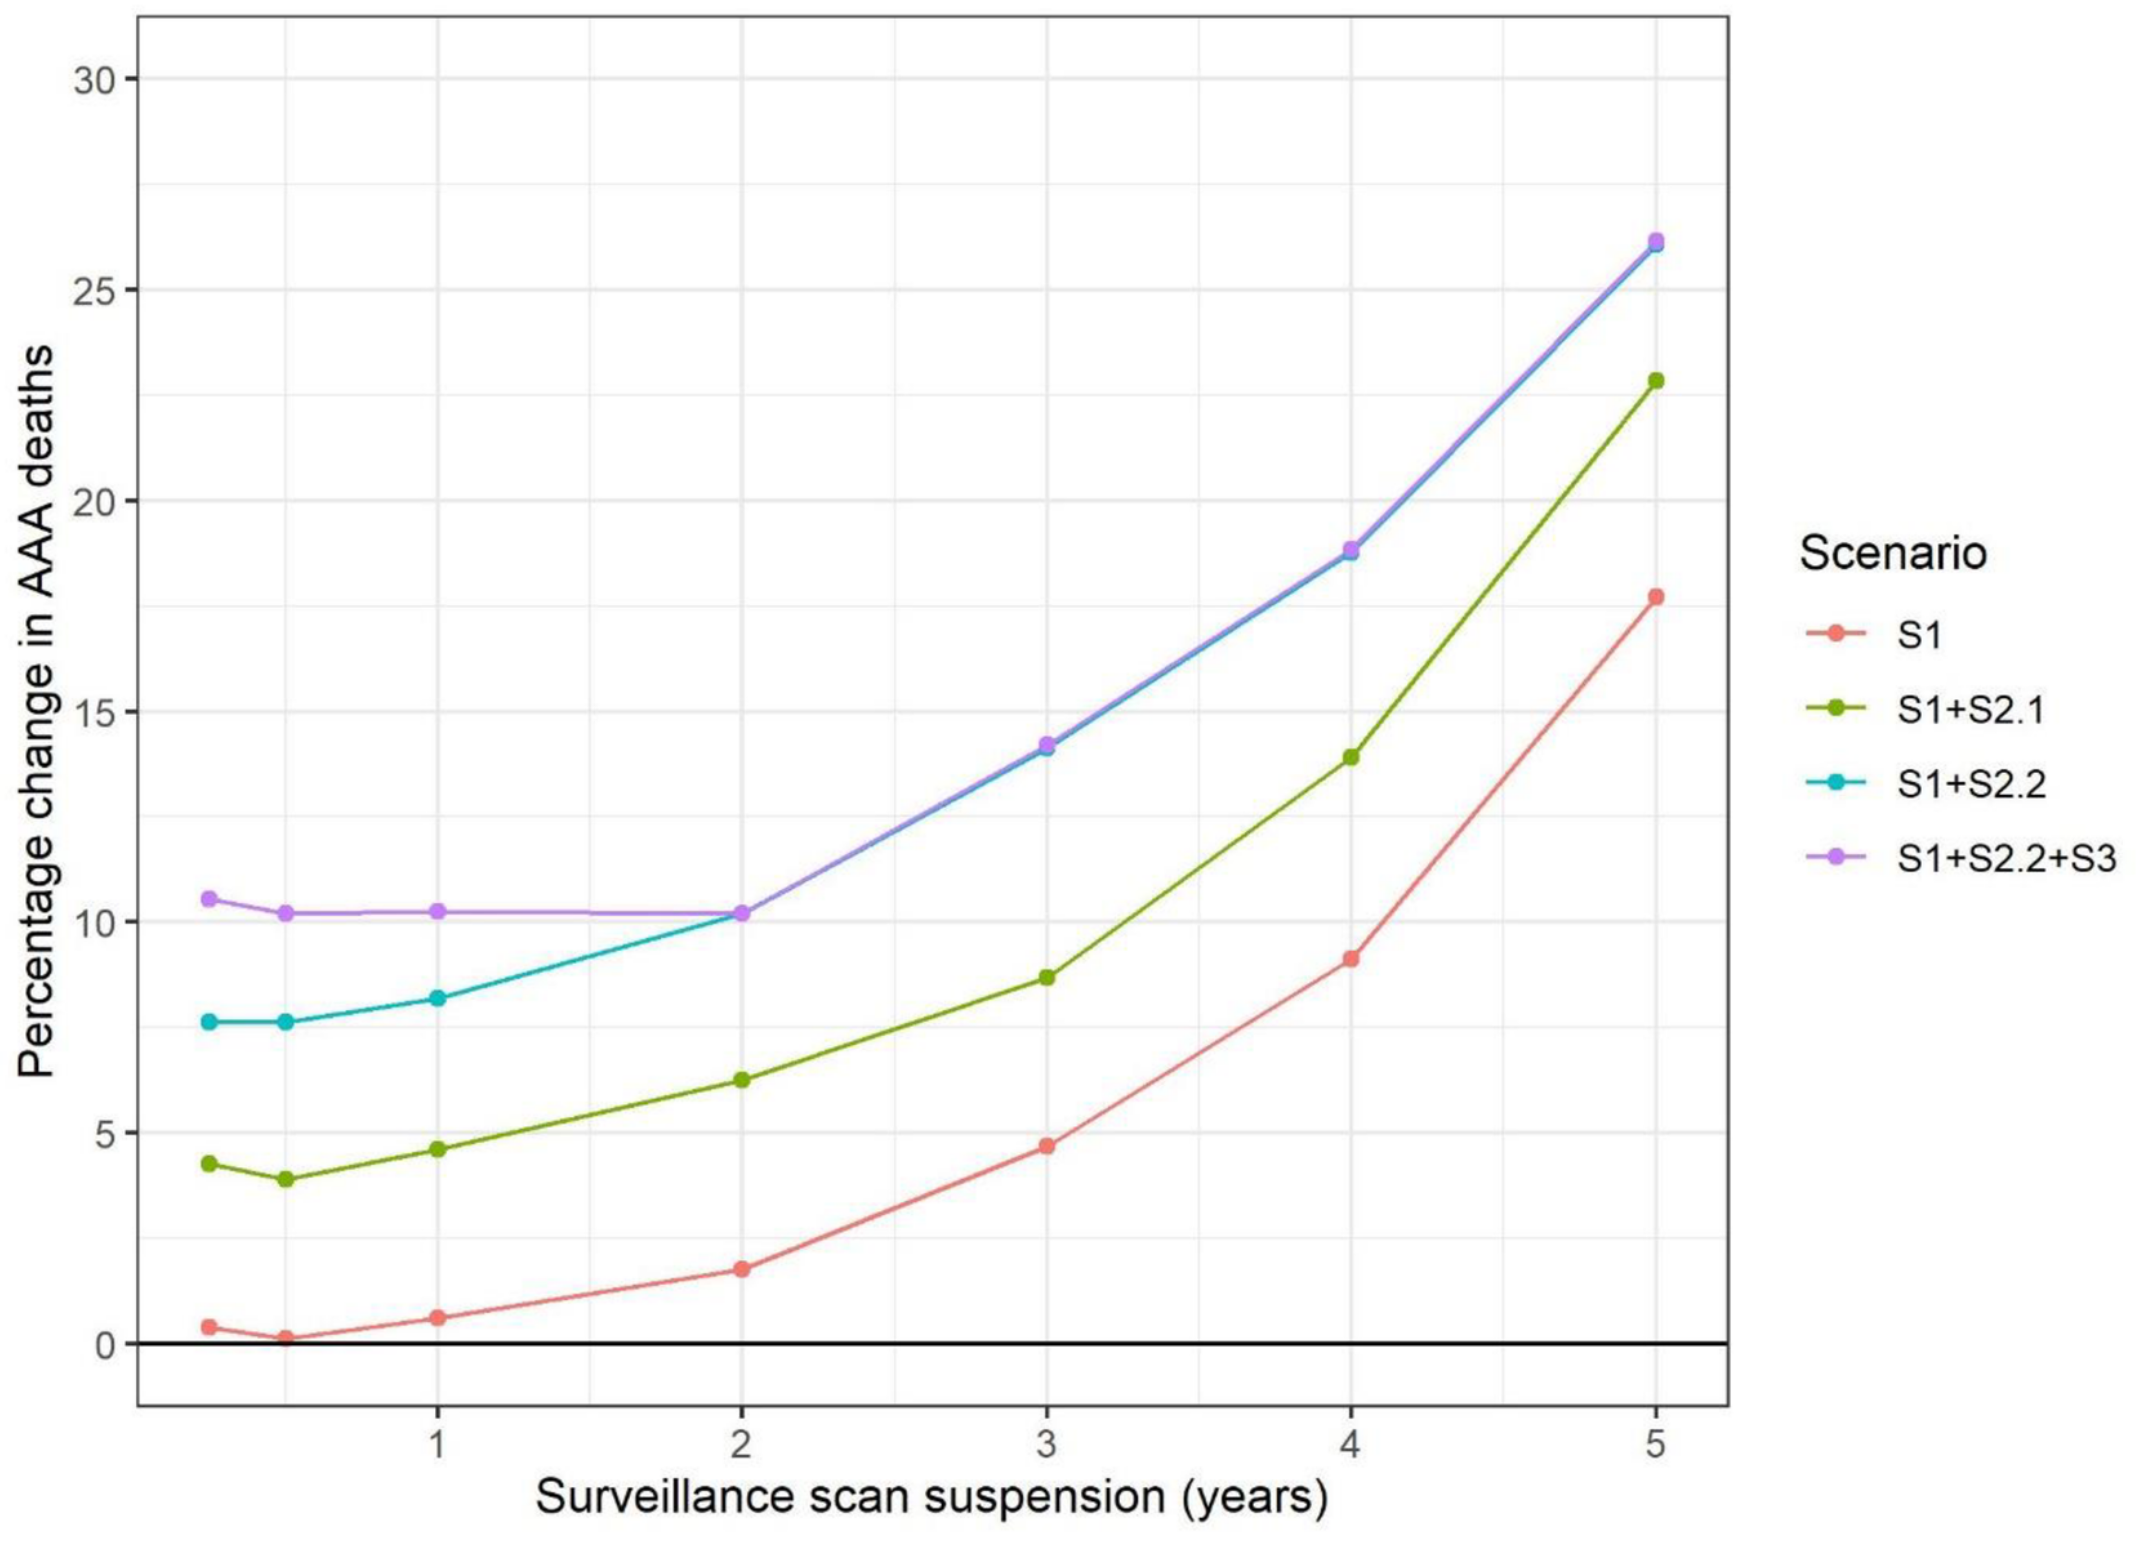
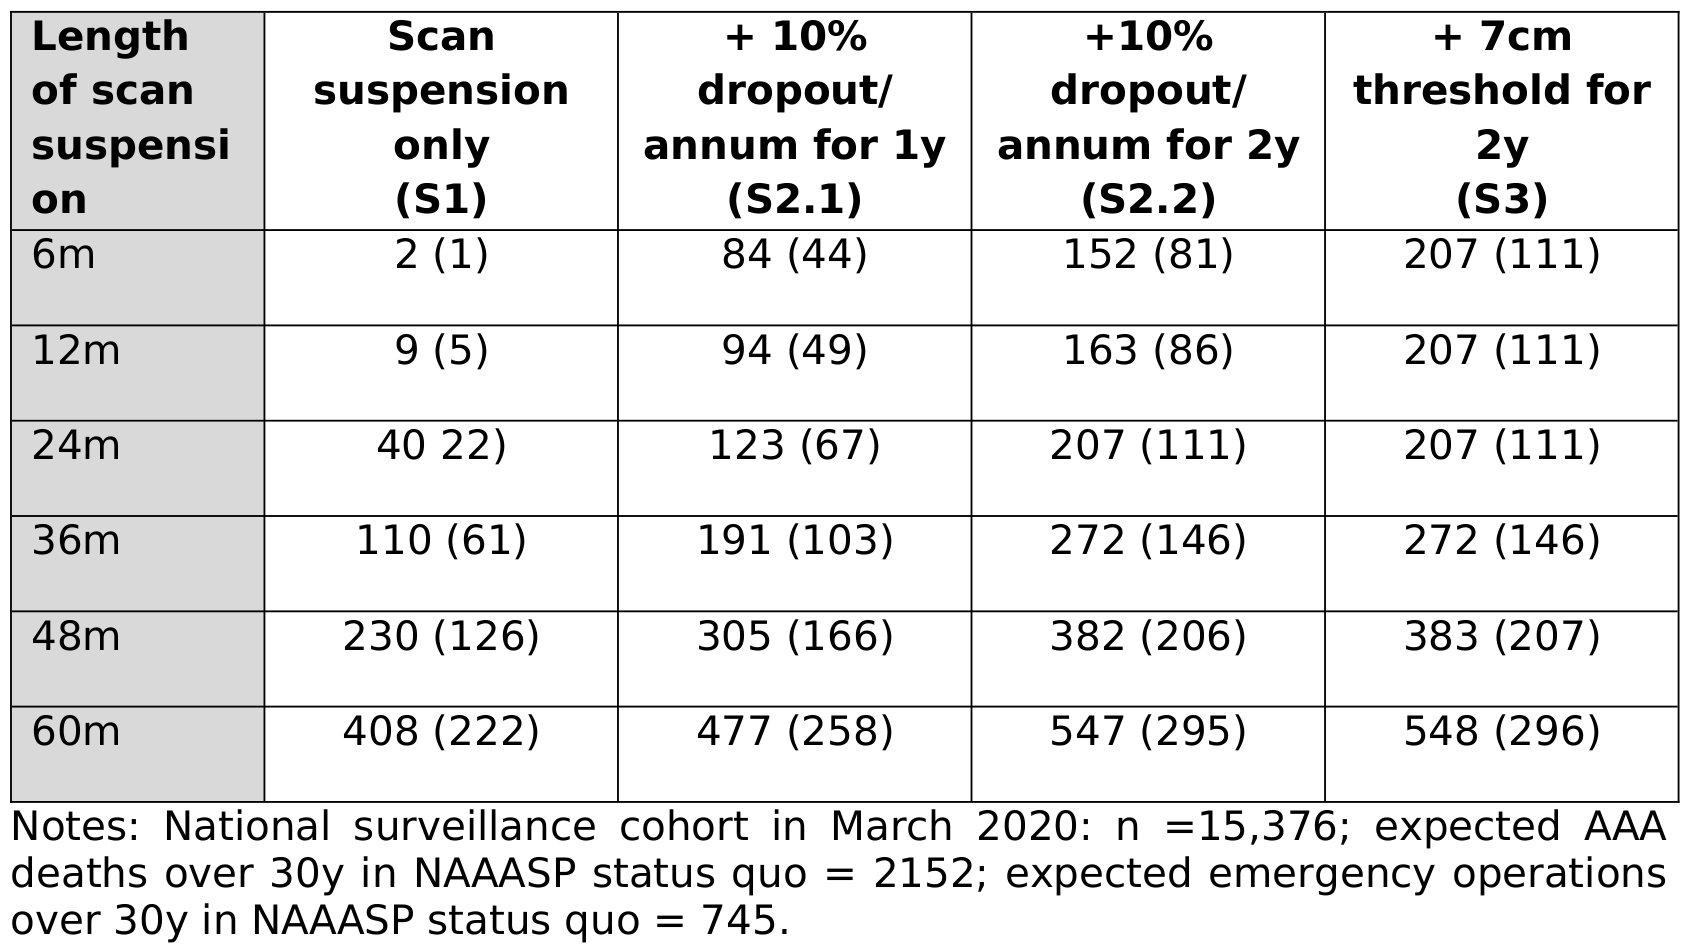
In bold are the items not captured in Table 3 or Figure 3.
“Suspending ultrasound scans in the surveillance cohort could result in 9 (0.4% increase) additional AAA-related deaths if scans were suspended for one year (Table 3, Fig 3). Of these, 2 (1% increase) are in the sub-group measuring 4.5–4.9 cm at the start of the pandemic and 7 (8% increase) in the sub-group measuring 5.0–5.4 cm; <0.1 are in the 3.0–4.4 cm sub-group. More pronounced effects are evident for suspension for two years and beyond. Suspending surveillance for two years could result in 40 excess AAA-related deaths overall; a 1.9% increase over the lifetime of the surveillance cohort. Of these, 1 is in the 3.0–4.4 cm sub-group and 17 (7% increase) in the 4.5–4.9cm sub-group. However, the remaining 22 excess deaths are in the 5.0–5.4cm range, corresponding to a 24% increase in AAA-related deaths in this sub-group.”
Outside scope
Input parameters and scenarios.
Part of methods (rather than a result from the model).
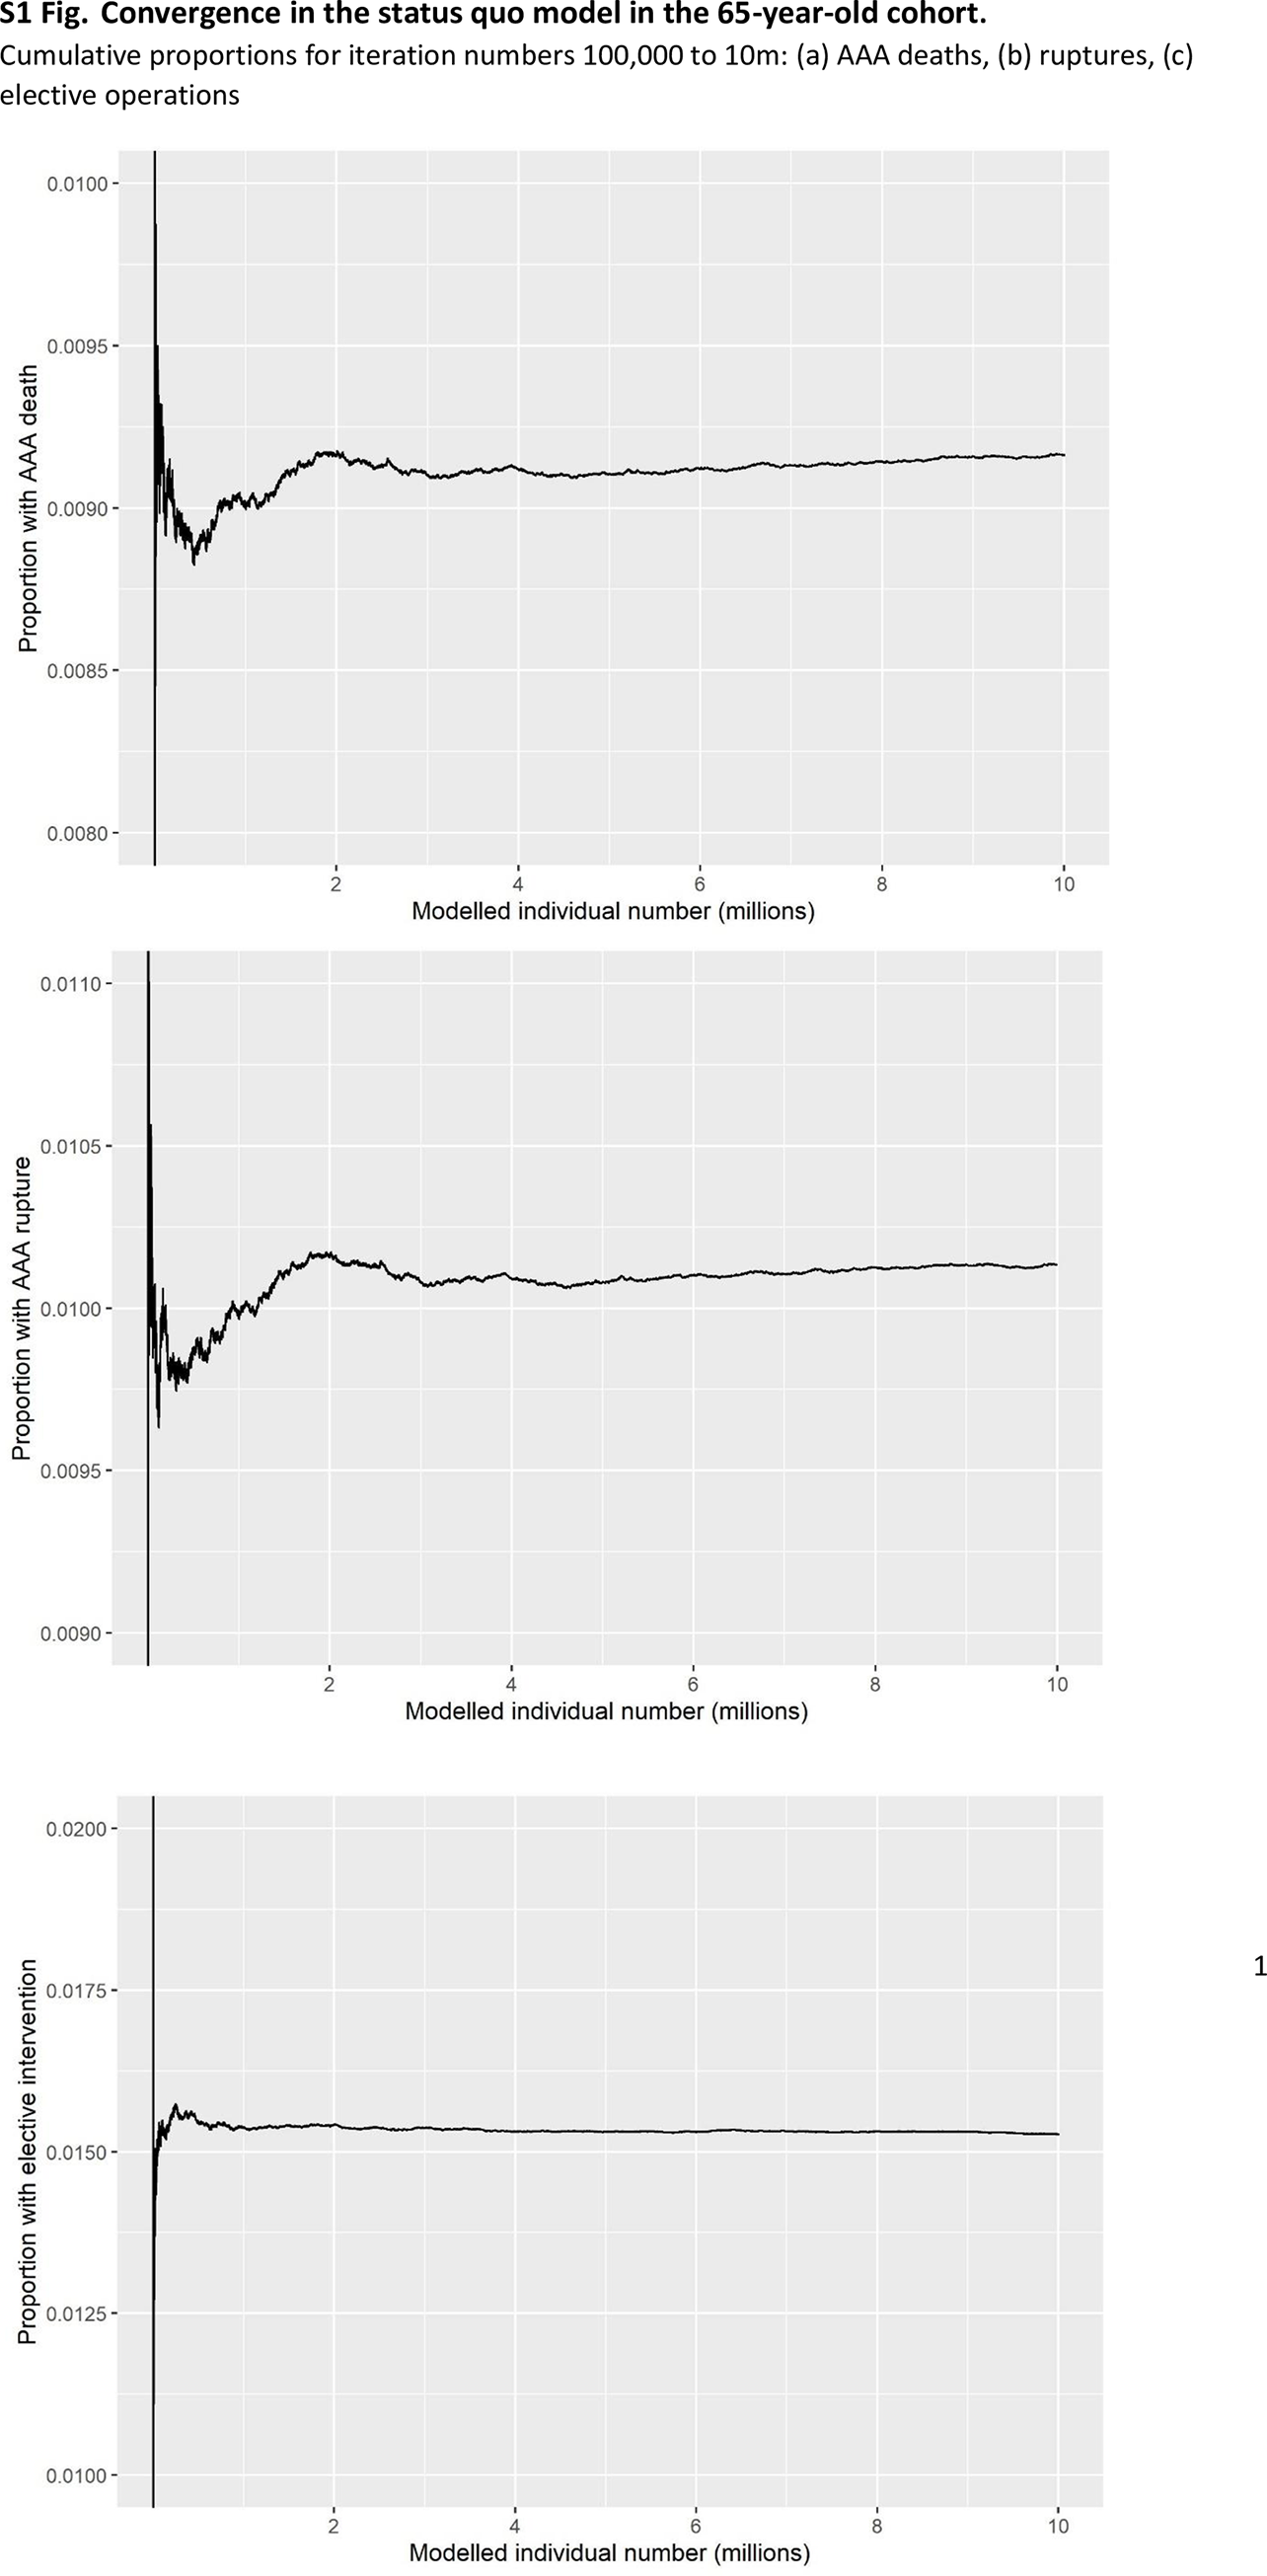
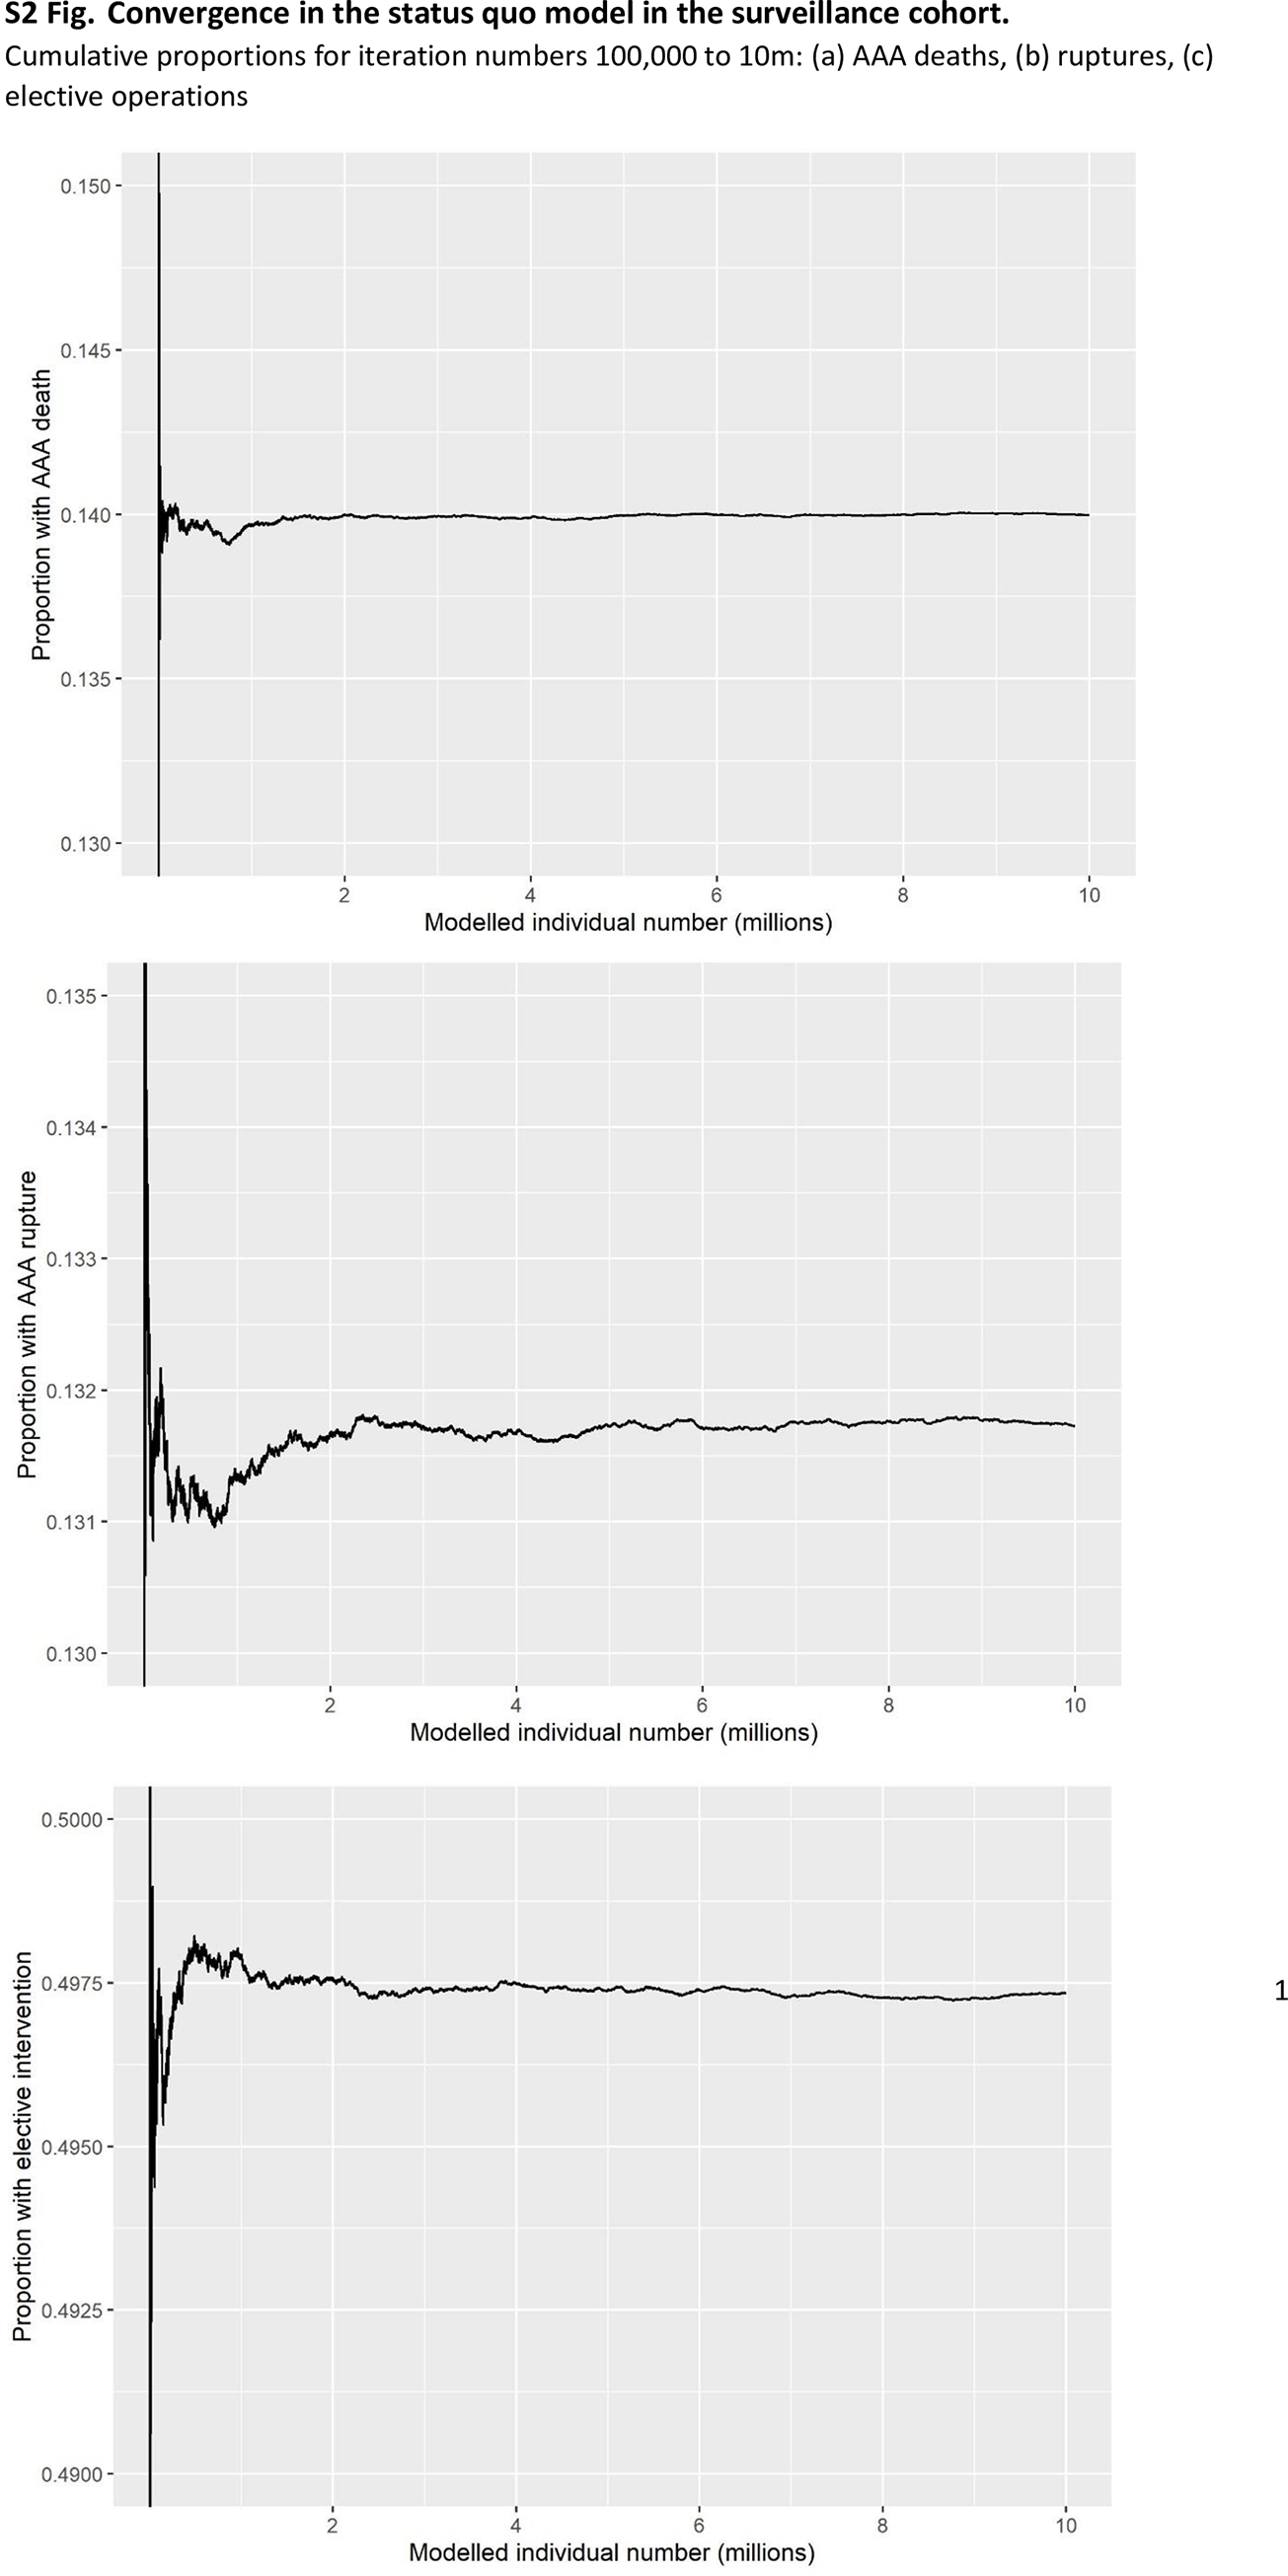
Part of methods (rather than a result from the model).
References
Kim, Lois G., Michael J. Sweeting, Morag Armer, Jo Jacomelli, Akhtar Nasim, and Seamus C. Harrison. 2021.
“Modelling the Impact of Changes to Abdominal Aortic Aneurysm Screening and Treatment Services in England During the COVID-19 Pandemic.” PLOS ONE 16 (6): e0253327.
https://doi.org/10.1371/journal.pone.0253327.


