| Length of delay to invitation | Excess AAA deaths (excess emergency operations) in Model I1* | Attendance rate at primary scan | Excess AAA deaths (excess emergency operations) in Model I2* | |
|---|---|---|---|---|
| 0 | 6m | 0 (3) | 65% | 61 (32) |
| 1 | 12m | 0 (0) | 55% | 127 (67) |
| 2 | 24m | 0 (1) | 45% | 184 (96) |
| 3 | 36m | 21 (14) | NaN | NaN |
| 4 | 48m | 56 (35) | NaN | NaN |
| 5 | 60m | 108 (56) | NaN | NaN |
Summary report
For computational reproducibility assessment of Kim et al. 2021
Study
Kim LG, Sweeting MJ, Armer M, Jacomelli J, Nasim A, Harrison SC. Modelling the impact of changes to abdominal aortic aneurysm screening and treatment services in England during the COVID-19 pandemic. PLoS ONE 16(6): e0253327 (2021). https://doi.org/10.1371/journal.pone.0253327.
This study adapts a previously developed DES model for abdominal aortic aneurysm (AAA) screening of men in England. It aims to explore different approaches to resuming screening and surgical repair for AAA, as these survives were paused or substantially reduced during COVID-19 due to concerns about virus transmission.
Computational reproducibility
Successfully reproduced 10 out of 10 (100%) of items from the scope in 14h 42m (36.8%).
Required troubleshooting:
- Reduce run time - reducing population size and setting to parallel to reduce runtime to a feasible level
- Fix error in script - fixing a minor error from switching between nested and unnested lists to provide a parameter
- Write code to implement scenarios and generate outputs - write code to find the aaorta sizes of people with AAA-related deaths, as well as code to produce all of the tables and figures from the model output
“Fig 1. 65-year-old cohort: Change in key outcomes over varying delay to primary invitation (model I1).” Kim et al. (2021)
“Table 2. Predicted excess AAA deaths and emergency operations in the national invited 65-year-old cohort over 30y period.” Kim et al. (2021)
“Fig 2. 65-year-old cohort: Change in key outcomes over varying attendance at primary scan (model I2).” Kim et al. (2021)
“Fig 3. Surveillance cohort: Change in key outcomes over varying suspension of surveillance scans (model S1).” Kim et al. (2021)
Original:
“Suspending ultrasound scans in the surveillance cohort could result in 9 (0.4% increase) additional AAA-related deaths if scans were suspended for one year (Table 3, Fig 3). Of these, 2 (1% increase) are in the sub-group measuring 4.5–4.9 cm at the start of the pandemic and 7 (8% increase) in the sub-group measuring 5.0–5.4 cm; <0.1 are in the 3.0–4.4 cm sub-group. More pronounced effects are evident for suspension for two years and beyond. Suspending surveillance for two years could result in 40 excess AAA-related deaths overall; a 1.9% increase over the lifetime of the surveillance cohort. Of these, 1 is in the 3.0–4.4 cm sub-group and 17 (7% increase) in the 4.5–4.9cm sub-group. However, the remaining 22 excess deaths are in the 5.0–5.4cm range, corresponding to a 24% increase in AAA-related deaths in this sub-group.”
Reproduction:
| years_of_surveillance_suspension | aorta_size | dead_scaled | extra_deaths | pct_change | |
|---|---|---|---|---|---|
| 0 | 0 | small | 1750 | 0 | 0.00 |
| 1 | 0 | med | 225 | 0 | 0.00 |
| 2 | 0 | large | 180 | 0 | 0.00 |
| 3 | 1 | small | 1750 | 0 | 0.00 |
| 4 | 1 | med | 227 | 2 | 0.89 |
| 5 | 1 | large | 187 | 7 | 3.89 |
| 6 | 2 | small | 1755 | 5 | 0.29 |
| 7 | 2 | med | 235 | 10 | 4.44 |
| 8 | 2 | large | 207 | 27 | 15.00 |
“Fig 4. Surveillance cohort: Change in key outcomes over varying dropout rates, applied for (i) 1y (model I2.1) and (ii) 2y (model I2.2).” Kim et al. (2021)
“Fig 5. Surveillance cohort: Change in key outcomes over varying time at increased (7cm) threshold (model I3).” Kim et al. (2021)
“Table 3. Predicted excess AAA deaths and emergency operations in the national surveillance cohort over 30y period.” Kim et al. (2021)
| Length of scan suspension | Excess AAA deaths (excess emergency operations) in Model S1 | Length of time at 7cm threshold | Excess AAA deaths (excess emergency operations) in Model S3 | Dropout rate/ annum | Excess AAA deaths (excess emergency operations) in Model S2.1 | Excess AAA deaths (excess emergency operations) in Model S2.2 | |
|---|---|---|---|---|---|---|---|
| 0 | 6m | 2 (0) | 6m | 2 (0) | 8% | 46 (24) | 85 (43) |
| 1 | 12m | 9 (4) | 12m | 10 (4) | 10% | 84 (43) | 153 (79) |
| 2 | 24m | 43 (23) | 24m | 42 (23) | 12% | 122 (62) | 218 (114) |
| 3 | 36m | 114 (64) | 36m | 101 (55) | 15% | 176 (91) | 313 (164) |
| 4 | 48m | 236 (127) | 48m | 179 (98) | NaN | NaN | NaN |
| 5 | 60m | 409 (223) | 60m | 262 (146) | NaN | NaN | NaN |
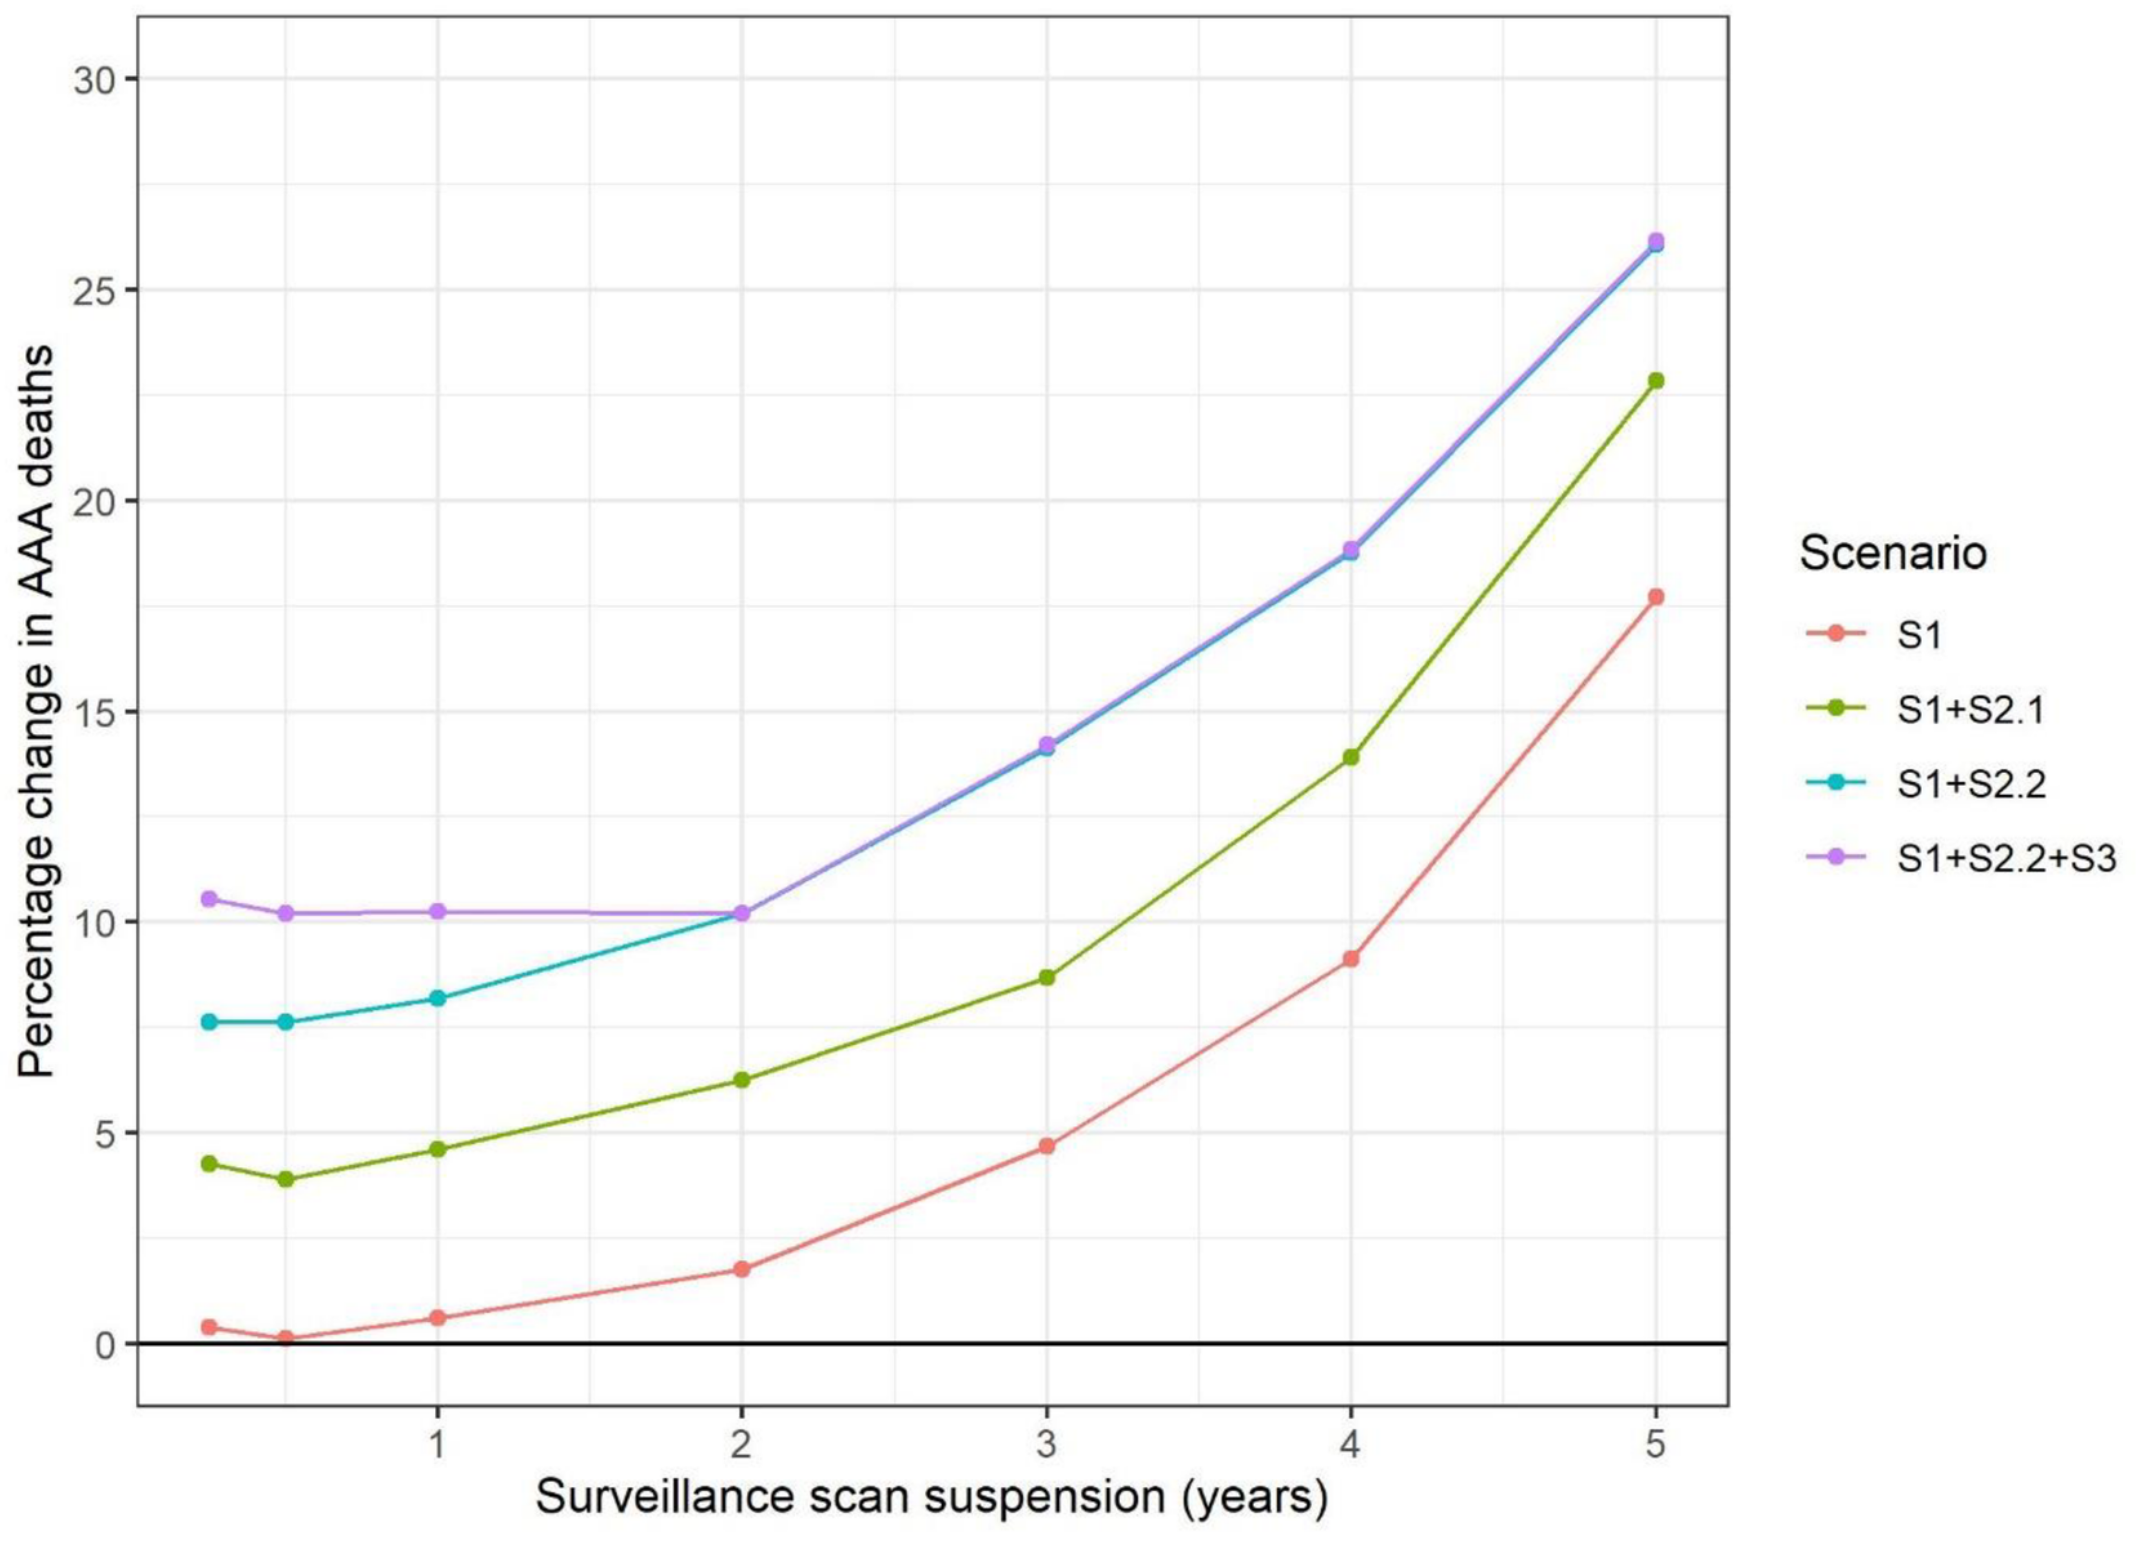
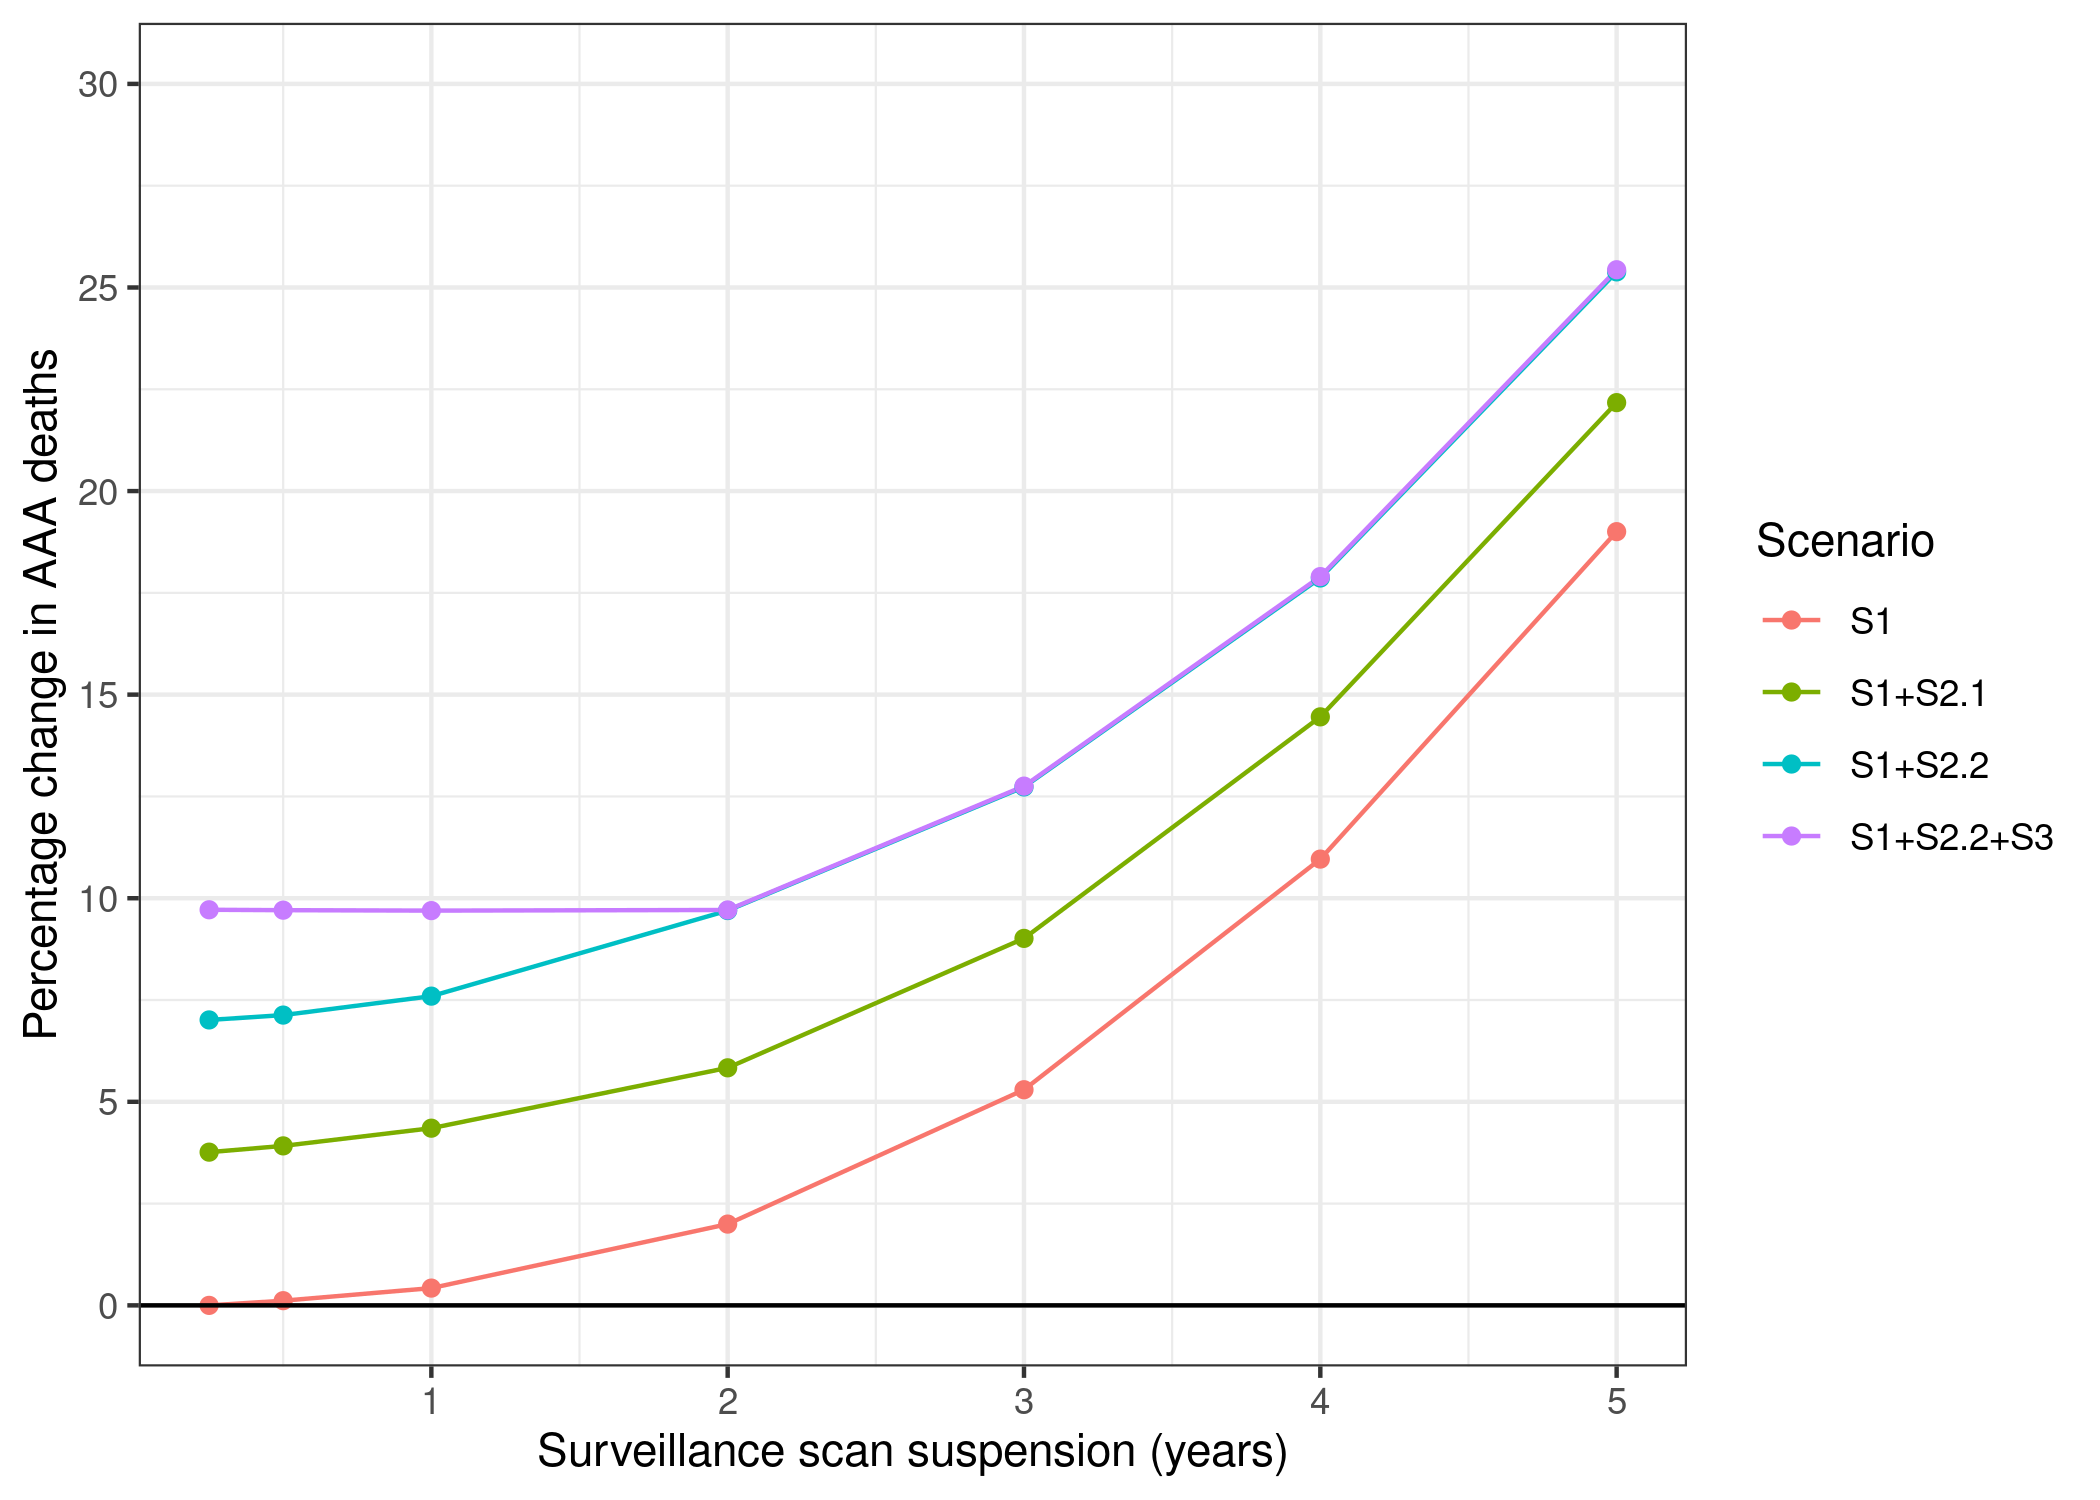
“S3 Fig. Cumulative impact of scenarios on surveillance cohort.” Kim et al. (2021)
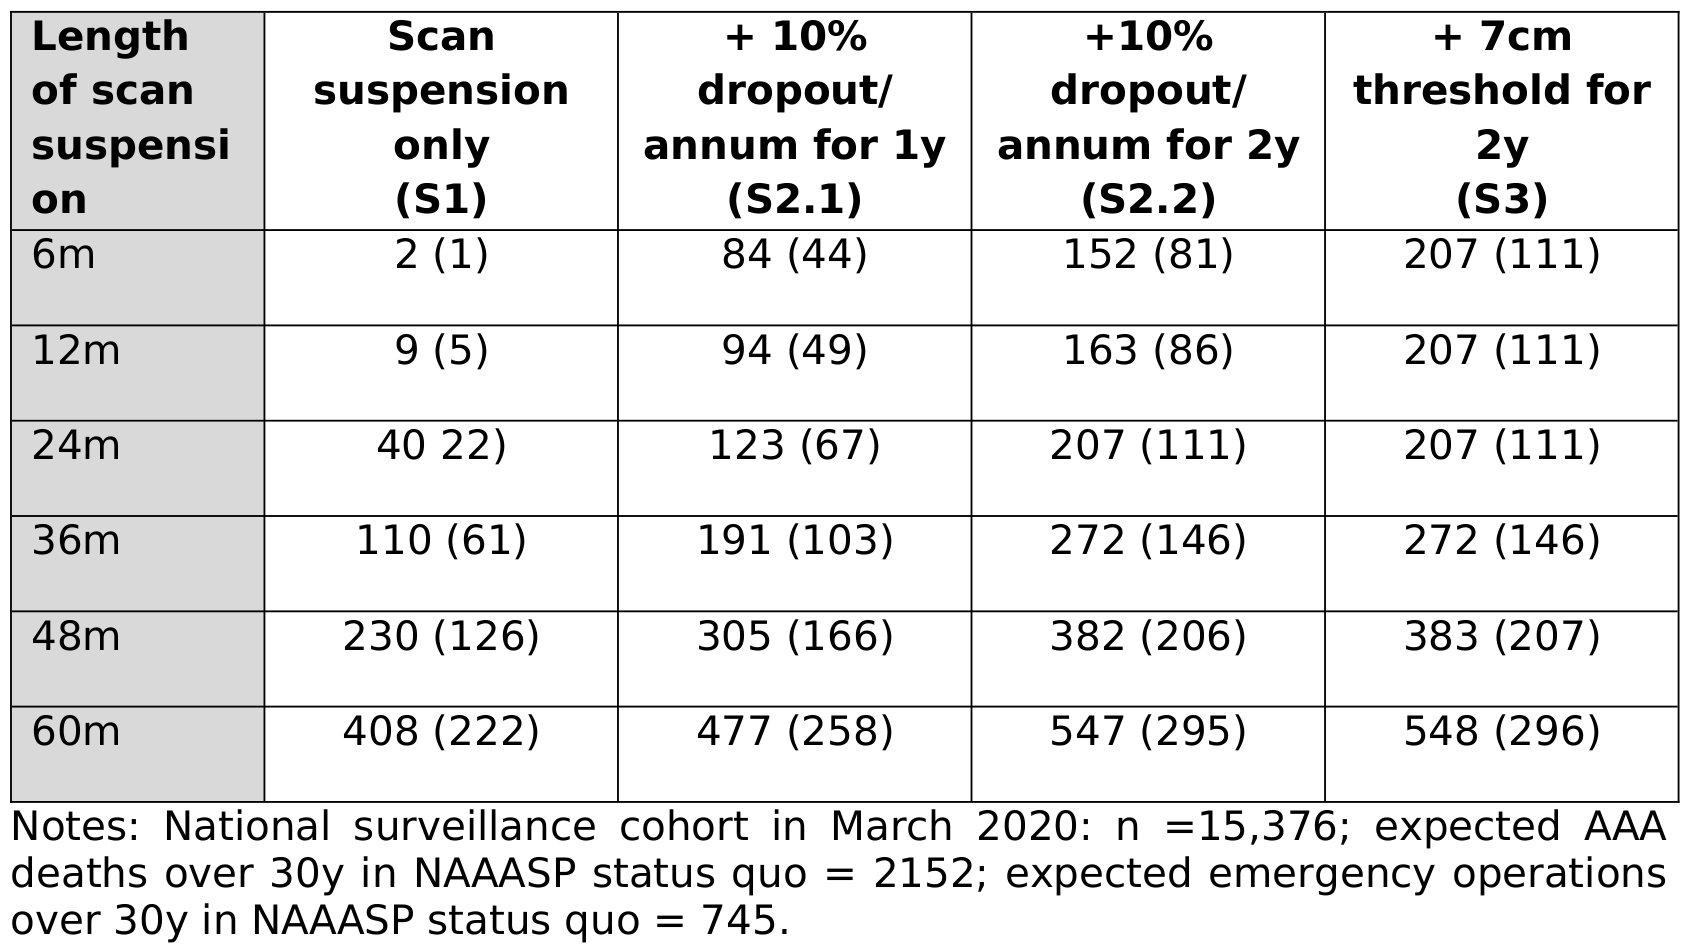
“S2 Tab. Predicted excess AAA deaths and emergency operations in the national surveillance cohort over 30y period” Kim et al. (2021)
| Length of scan suspension | Scan suspension only (S1) | +10% dropout/ annum for 1y (S2.1) | +10% dropout/ annum for 2y (S2.2) | +7cm threshold for 2y (S3) | |
|---|---|---|---|---|---|
| 0 | 6m | 2 (0) | 84 (43) | 153 (79) | 209 (111) |
| 1 | 12m | 9 (4) | 94 (49) | 164 (85) | 209 (111) |
| 2 | 24m | 43 (23) | 126 (67) | 209 (112) | 209 (112) |
| 3 | 36m | 114 (64) | 194 (106) | 274 (147) | 275 (148) |
| 4 | 48m | 236 (127) | 311 (166) | 385 (207) | 386 (207) |
| 5 | 60m | 409 (223) | 478 (259) | 547 (297) | 548 (298) |
Evaluation against guidelines
Context: The original study repository was evaluated against criteria from journal badges relating to how open and reproducible the model is and against guidance for sharing artefacts from the STARS framework. The original study article and supplementary materials (excluding code) were evaluated against reporting guidelines for DES models: STRESS-DES, and guidelines adapted from ISPOR-SDM.


