Reproduction success
Of the 10 items in the scope, 100% (10 out of 10) were considered to be successfully reproduced.
As cited throughout, images on this page are sourced from Kim et al. (2021)
Note: This items have been reproduced with simulations containing 1,000,000 people (instead of 10,000,000) as that is very computationally expensive. We felt that, with 1,000,000 people, results are reasonably similar enough to be satisified with reproduction, whilst still being feasible to run on our machines.
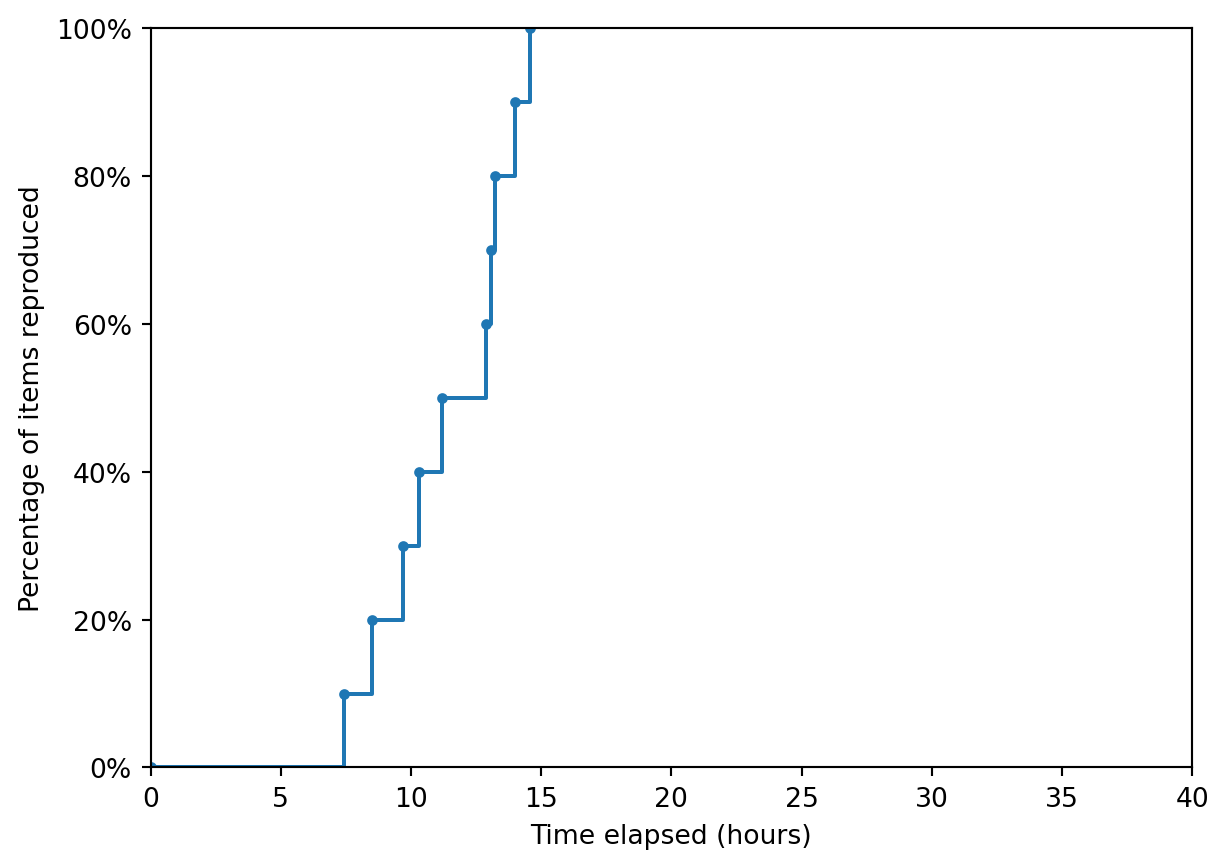
Time-to-completion
Non-interactive plot:
Interactive plot:
Figure 1
Consensus: Successfully reproduced
Original (Kim et al. (2021)):
Reproduction:
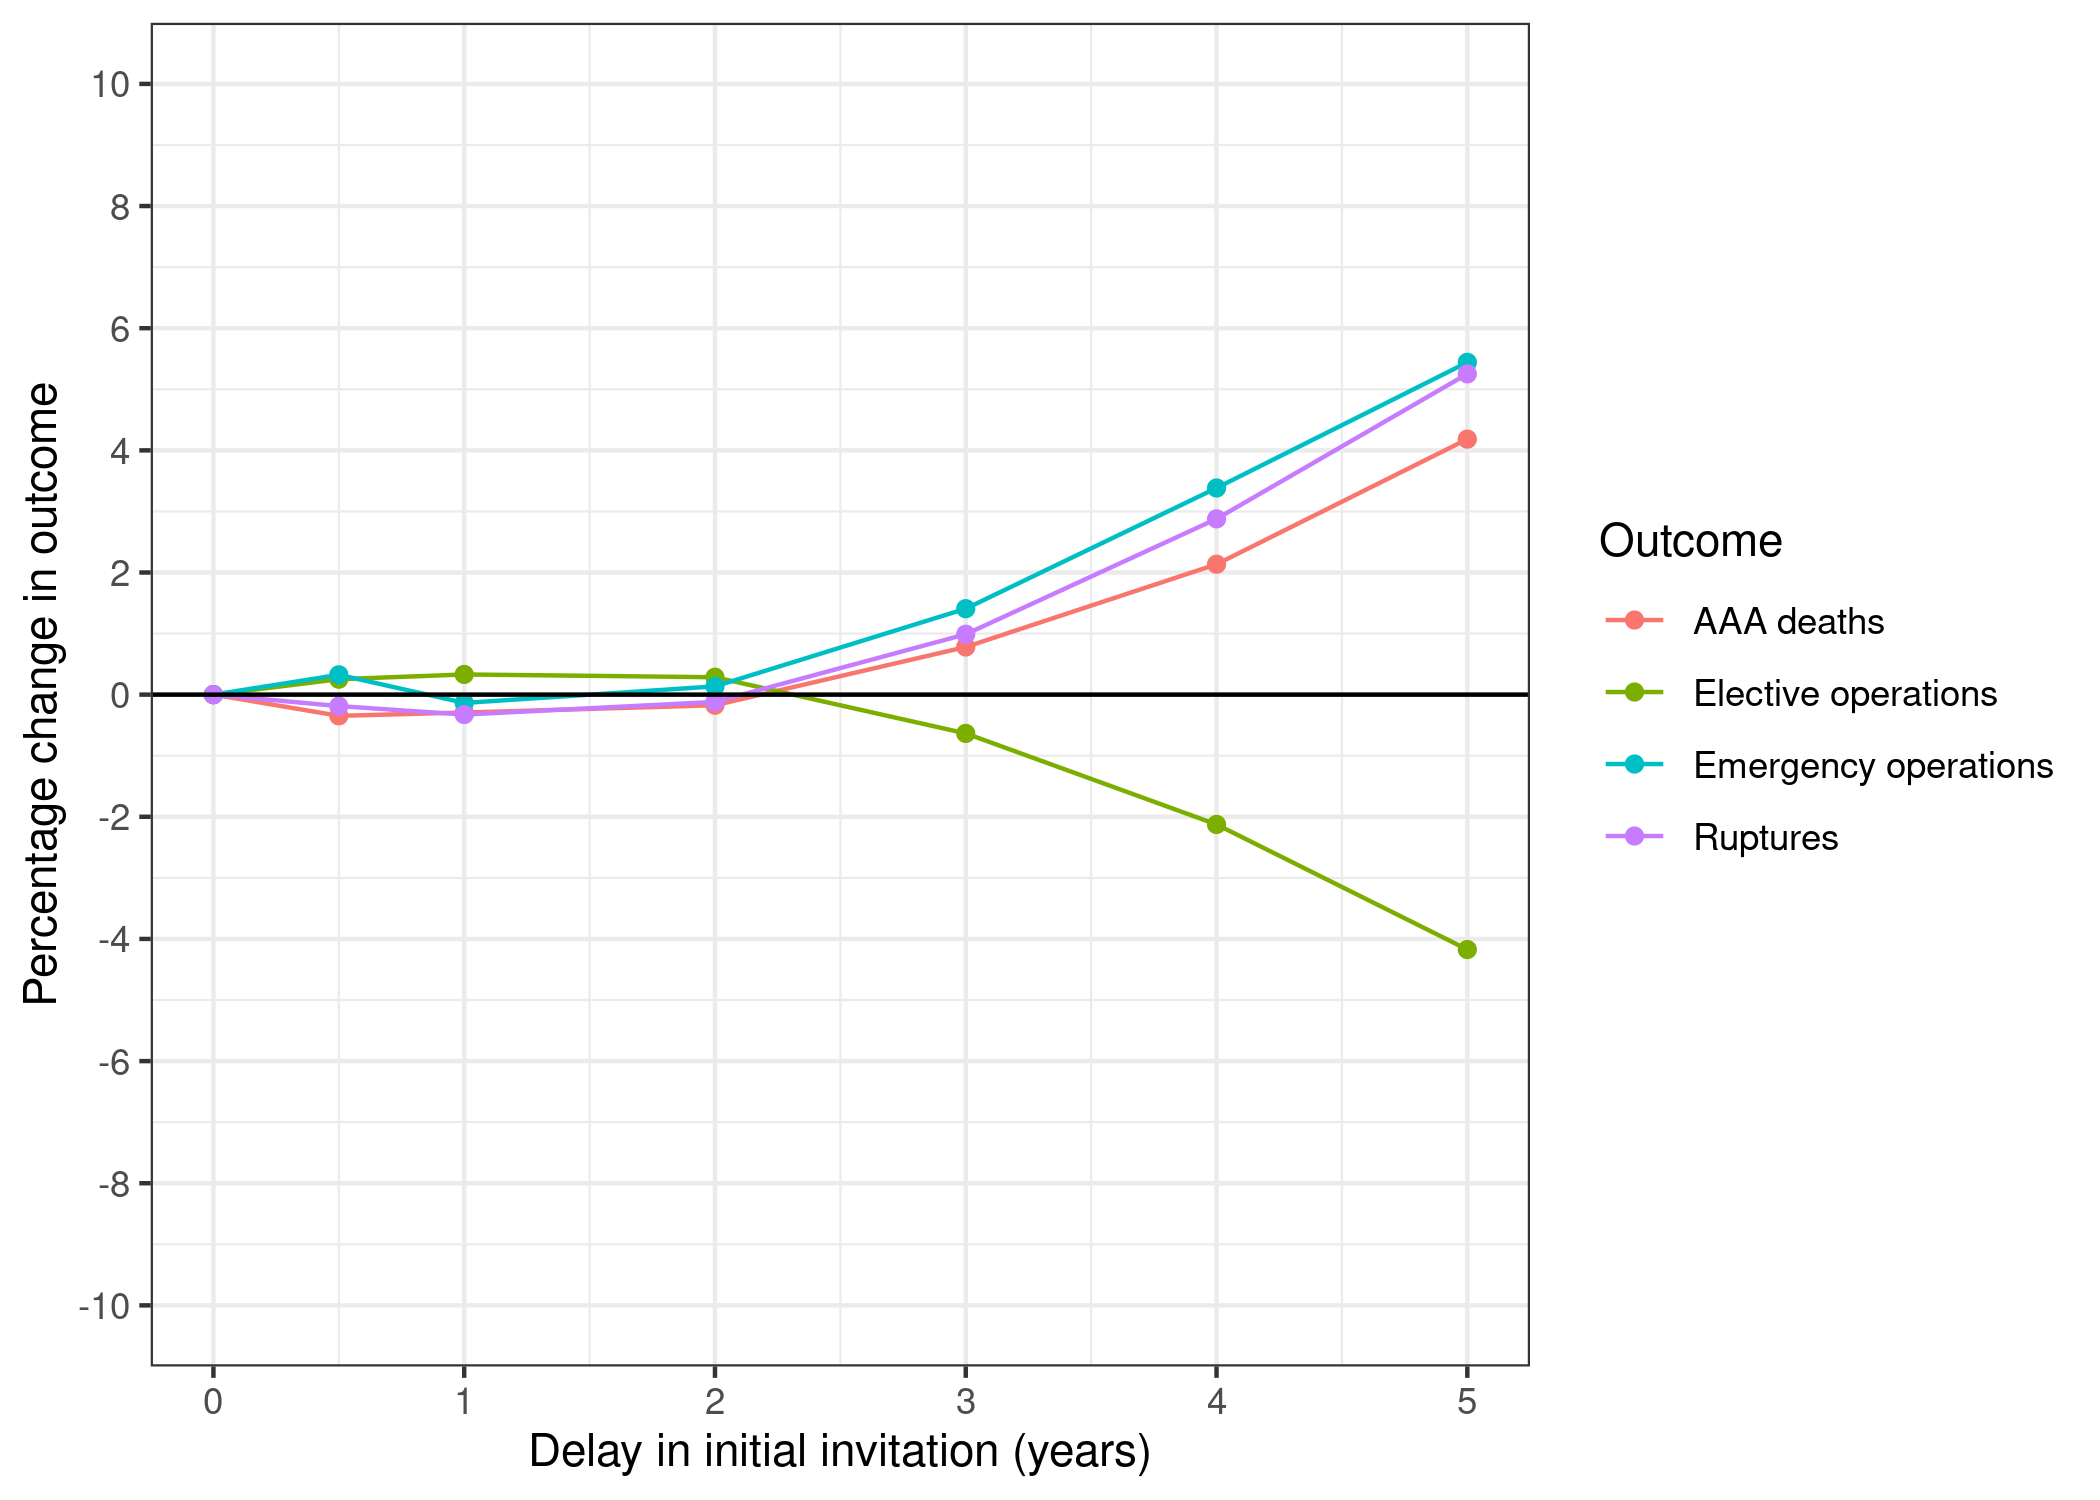
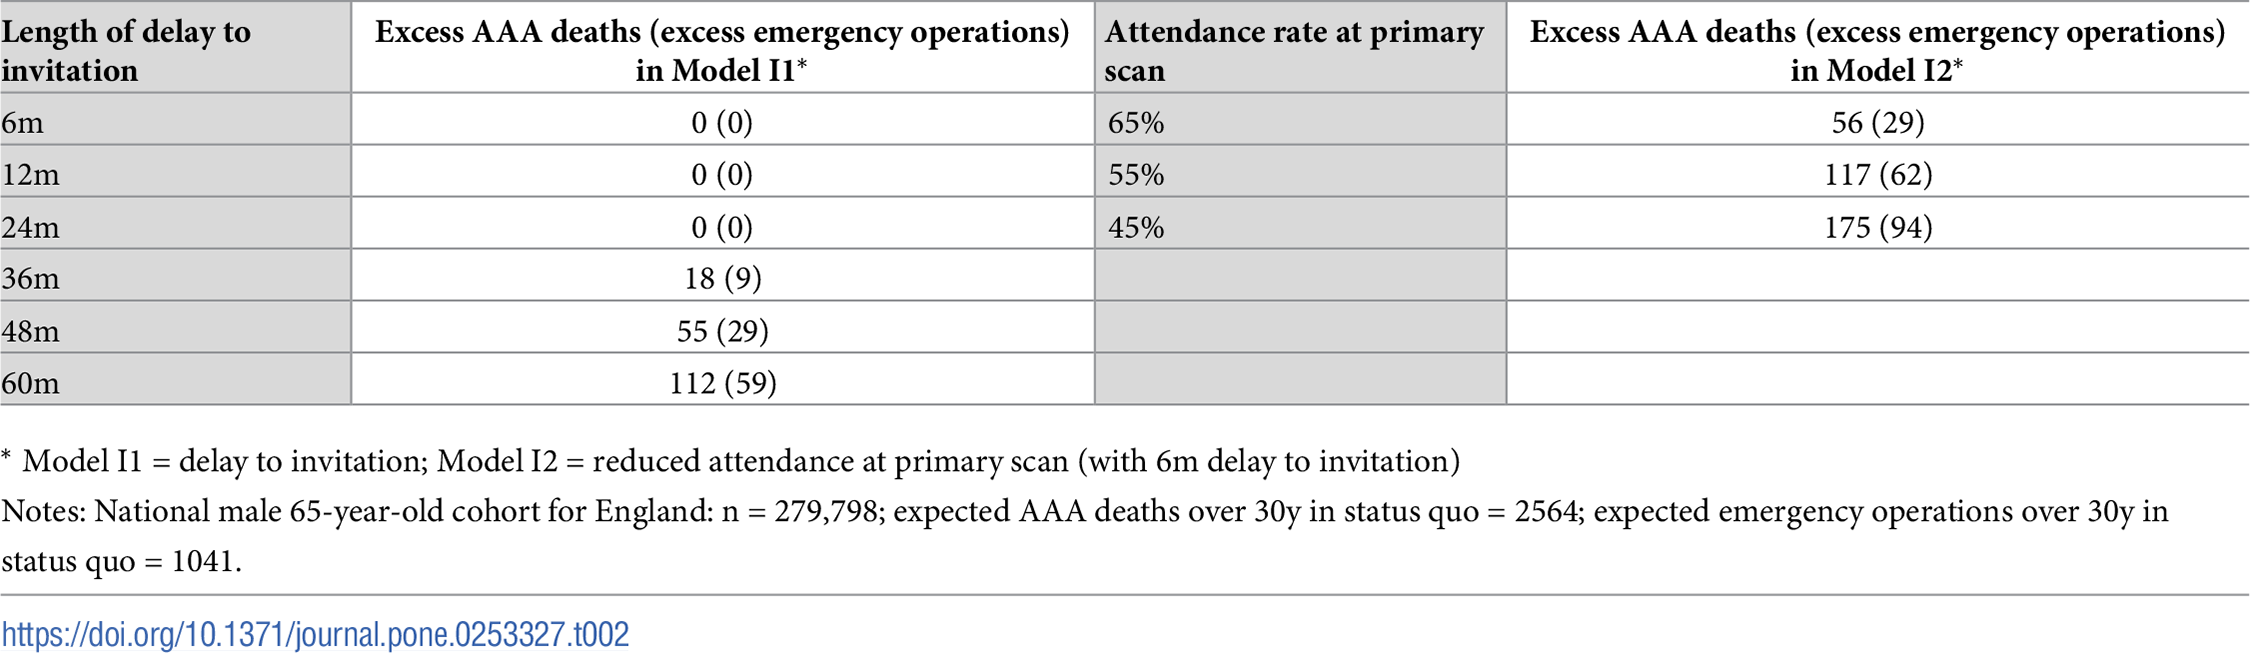
Table 2
Consensus: Successfully reproduced
Original (Kim et al. (2021)):
Reproduction:
| Length of delay to invitation | Excess AAA deaths (excess emergency operations) in Model I1* | Attendance rate at primary scan | Excess AAA deaths (excess emergency operations) in Model I2* | |
|---|---|---|---|---|
| 0 | 6m | 0 (3) | 65% | 61 (32) |
| 1 | 12m | 0 (0) | 55% | 127 (67) |
| 2 | 24m | 0 (1) | 45% | 184 (96) |
| 3 | 36m | 21 (14) | NaN | NaN |
| 4 | 48m | 56 (35) | NaN | NaN |
| 5 | 60m | 108 (56) | NaN | NaN |
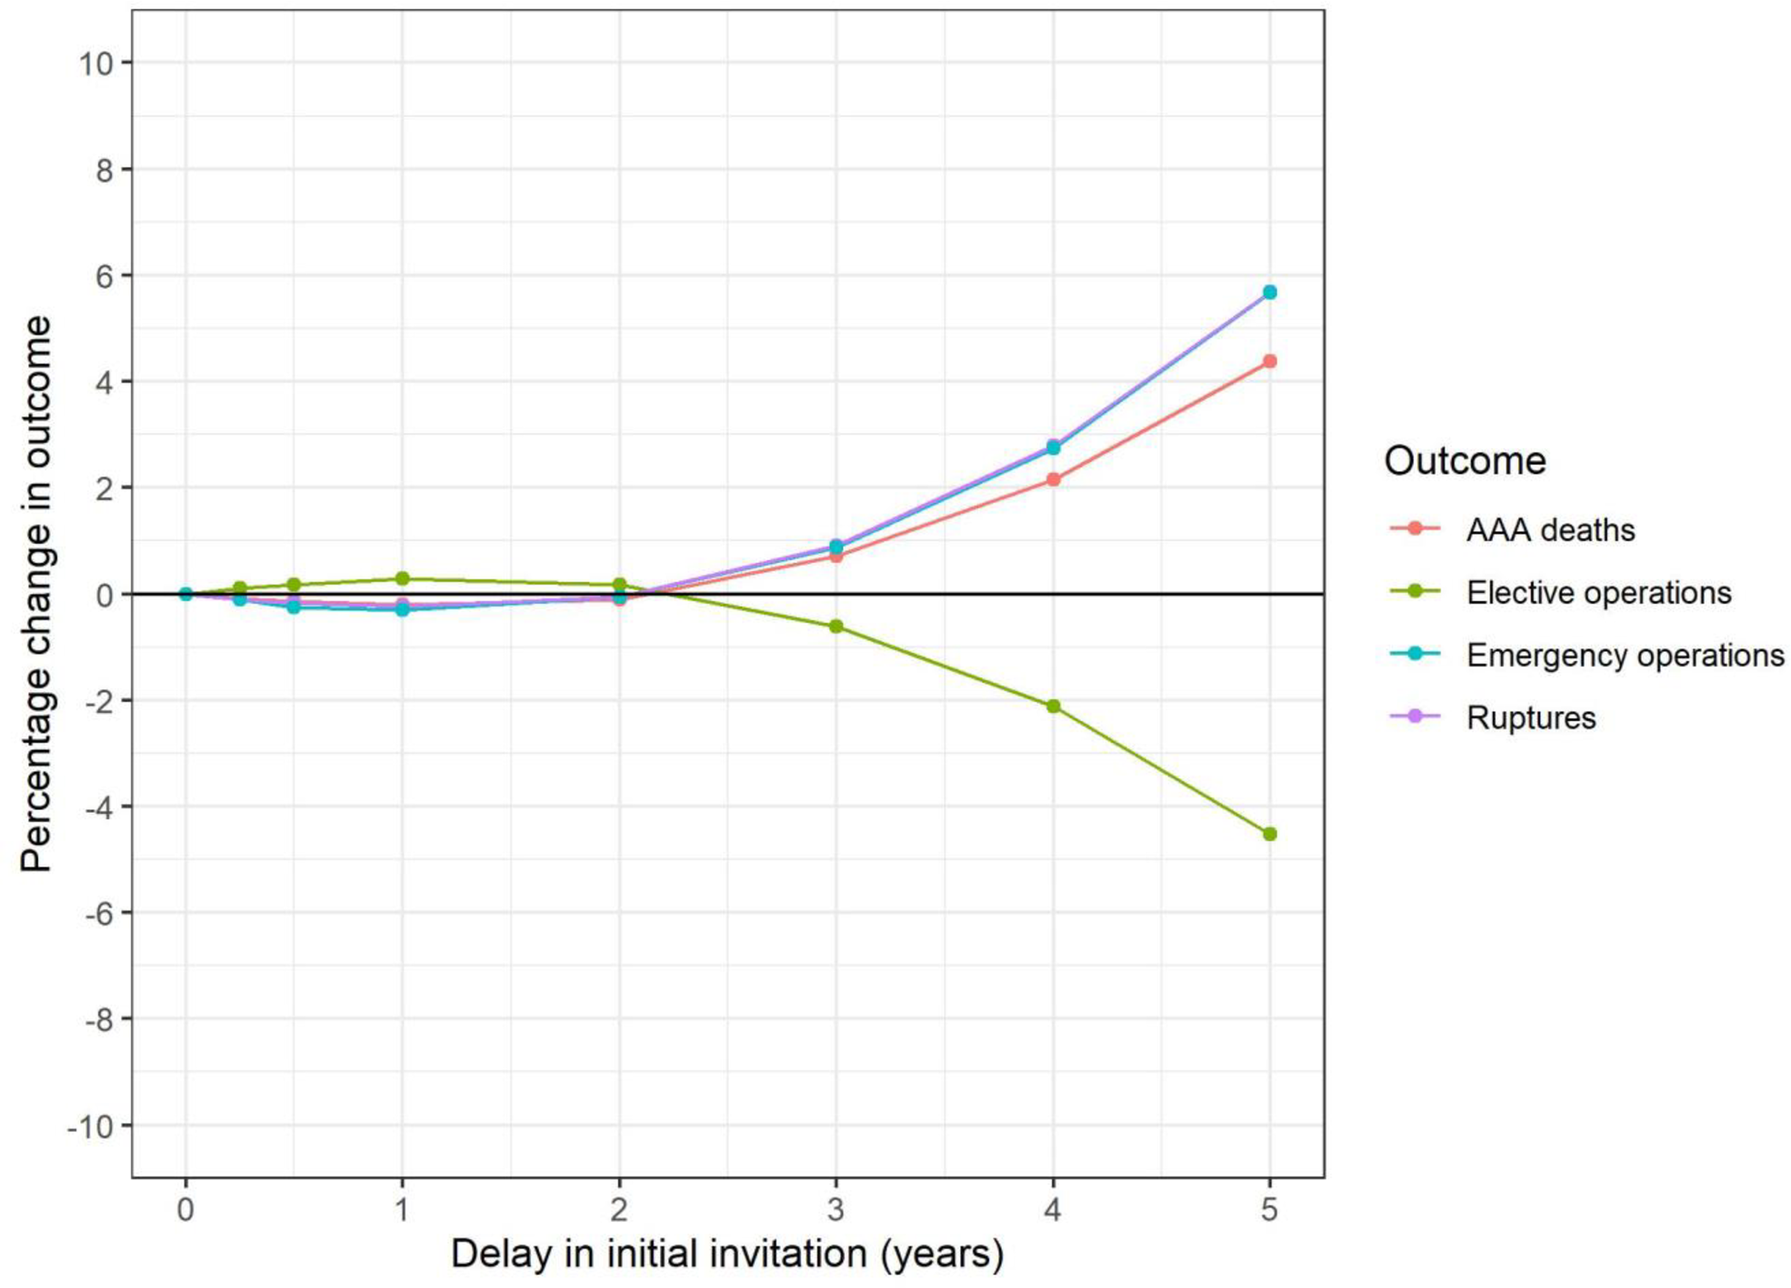
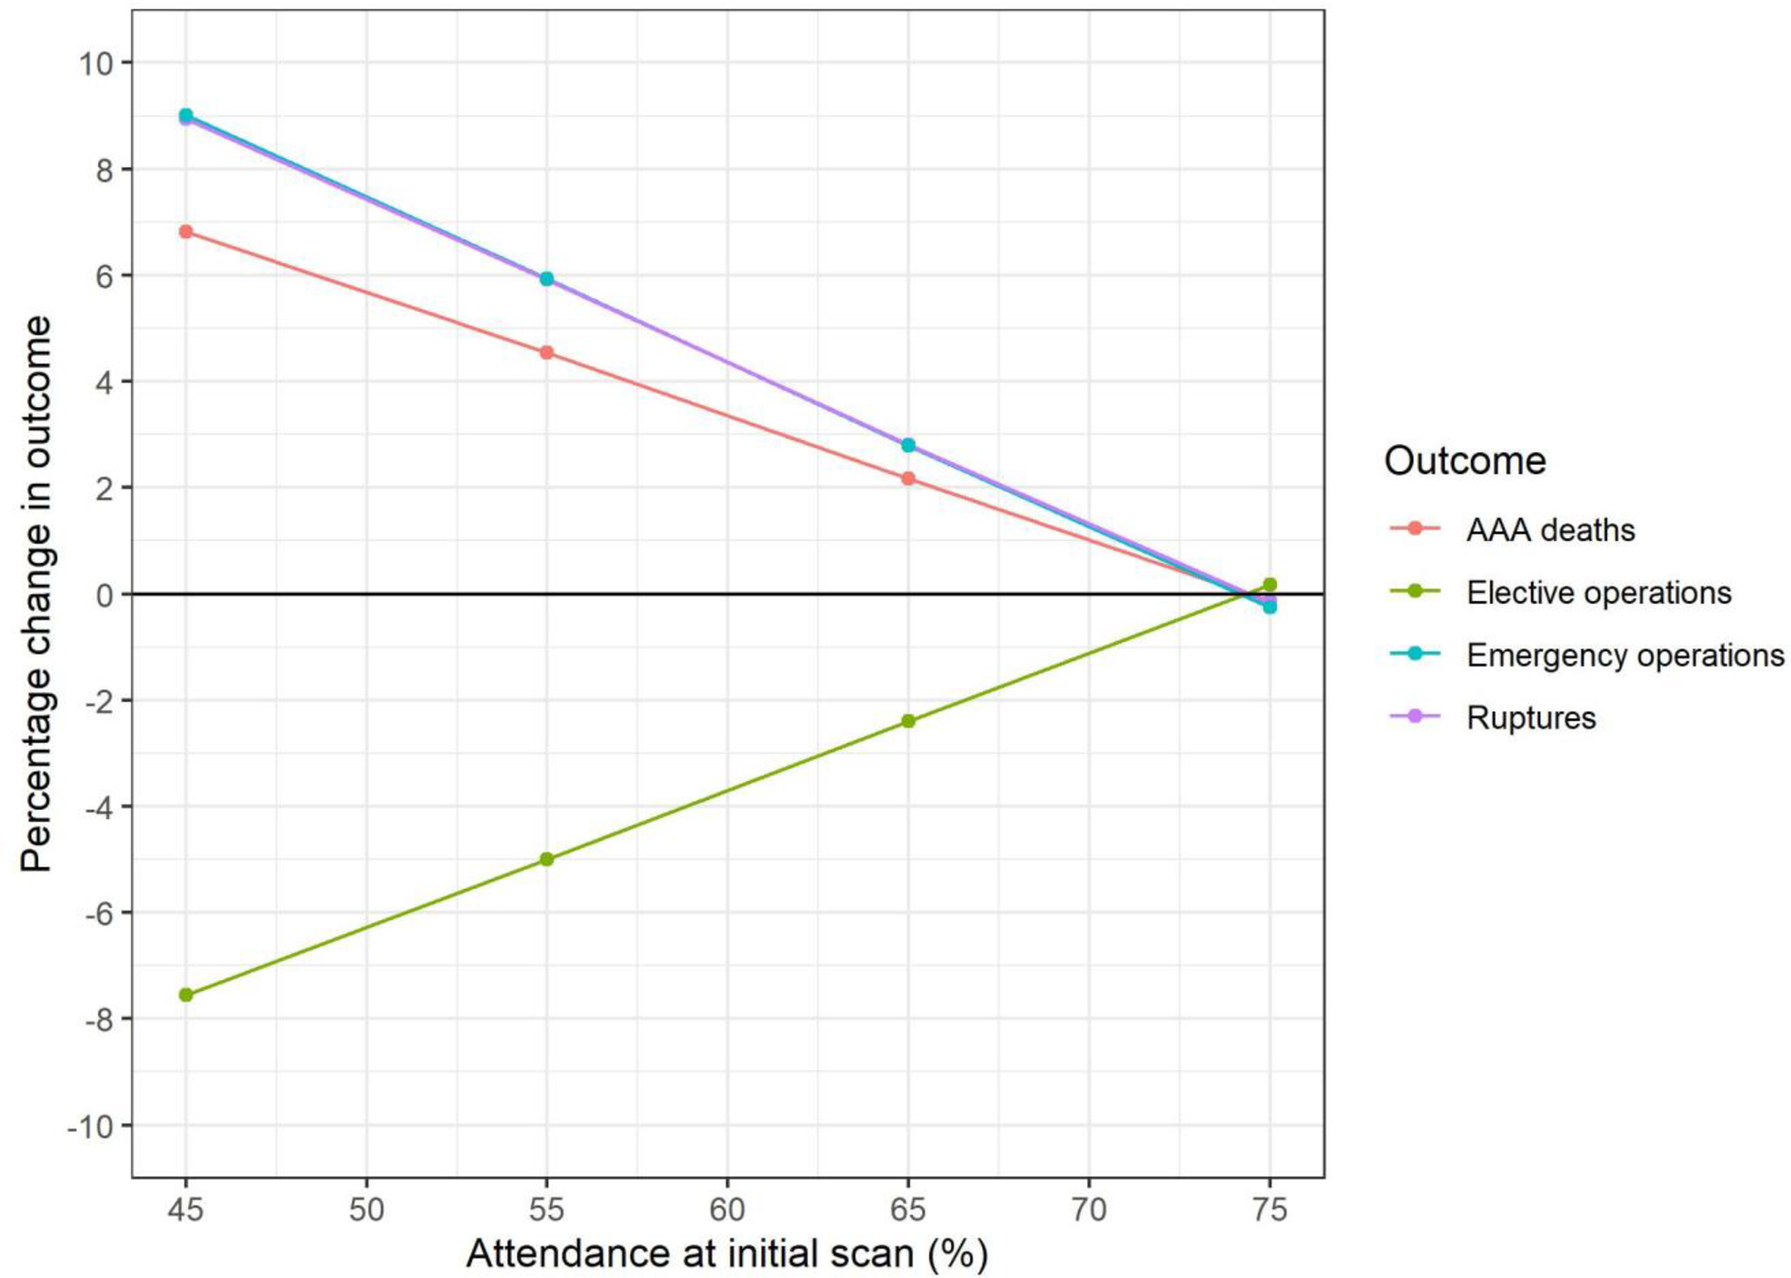
Figure 2
Consensus: Successfully reproduced
Original (Kim et al. (2021)):
Reproduction:
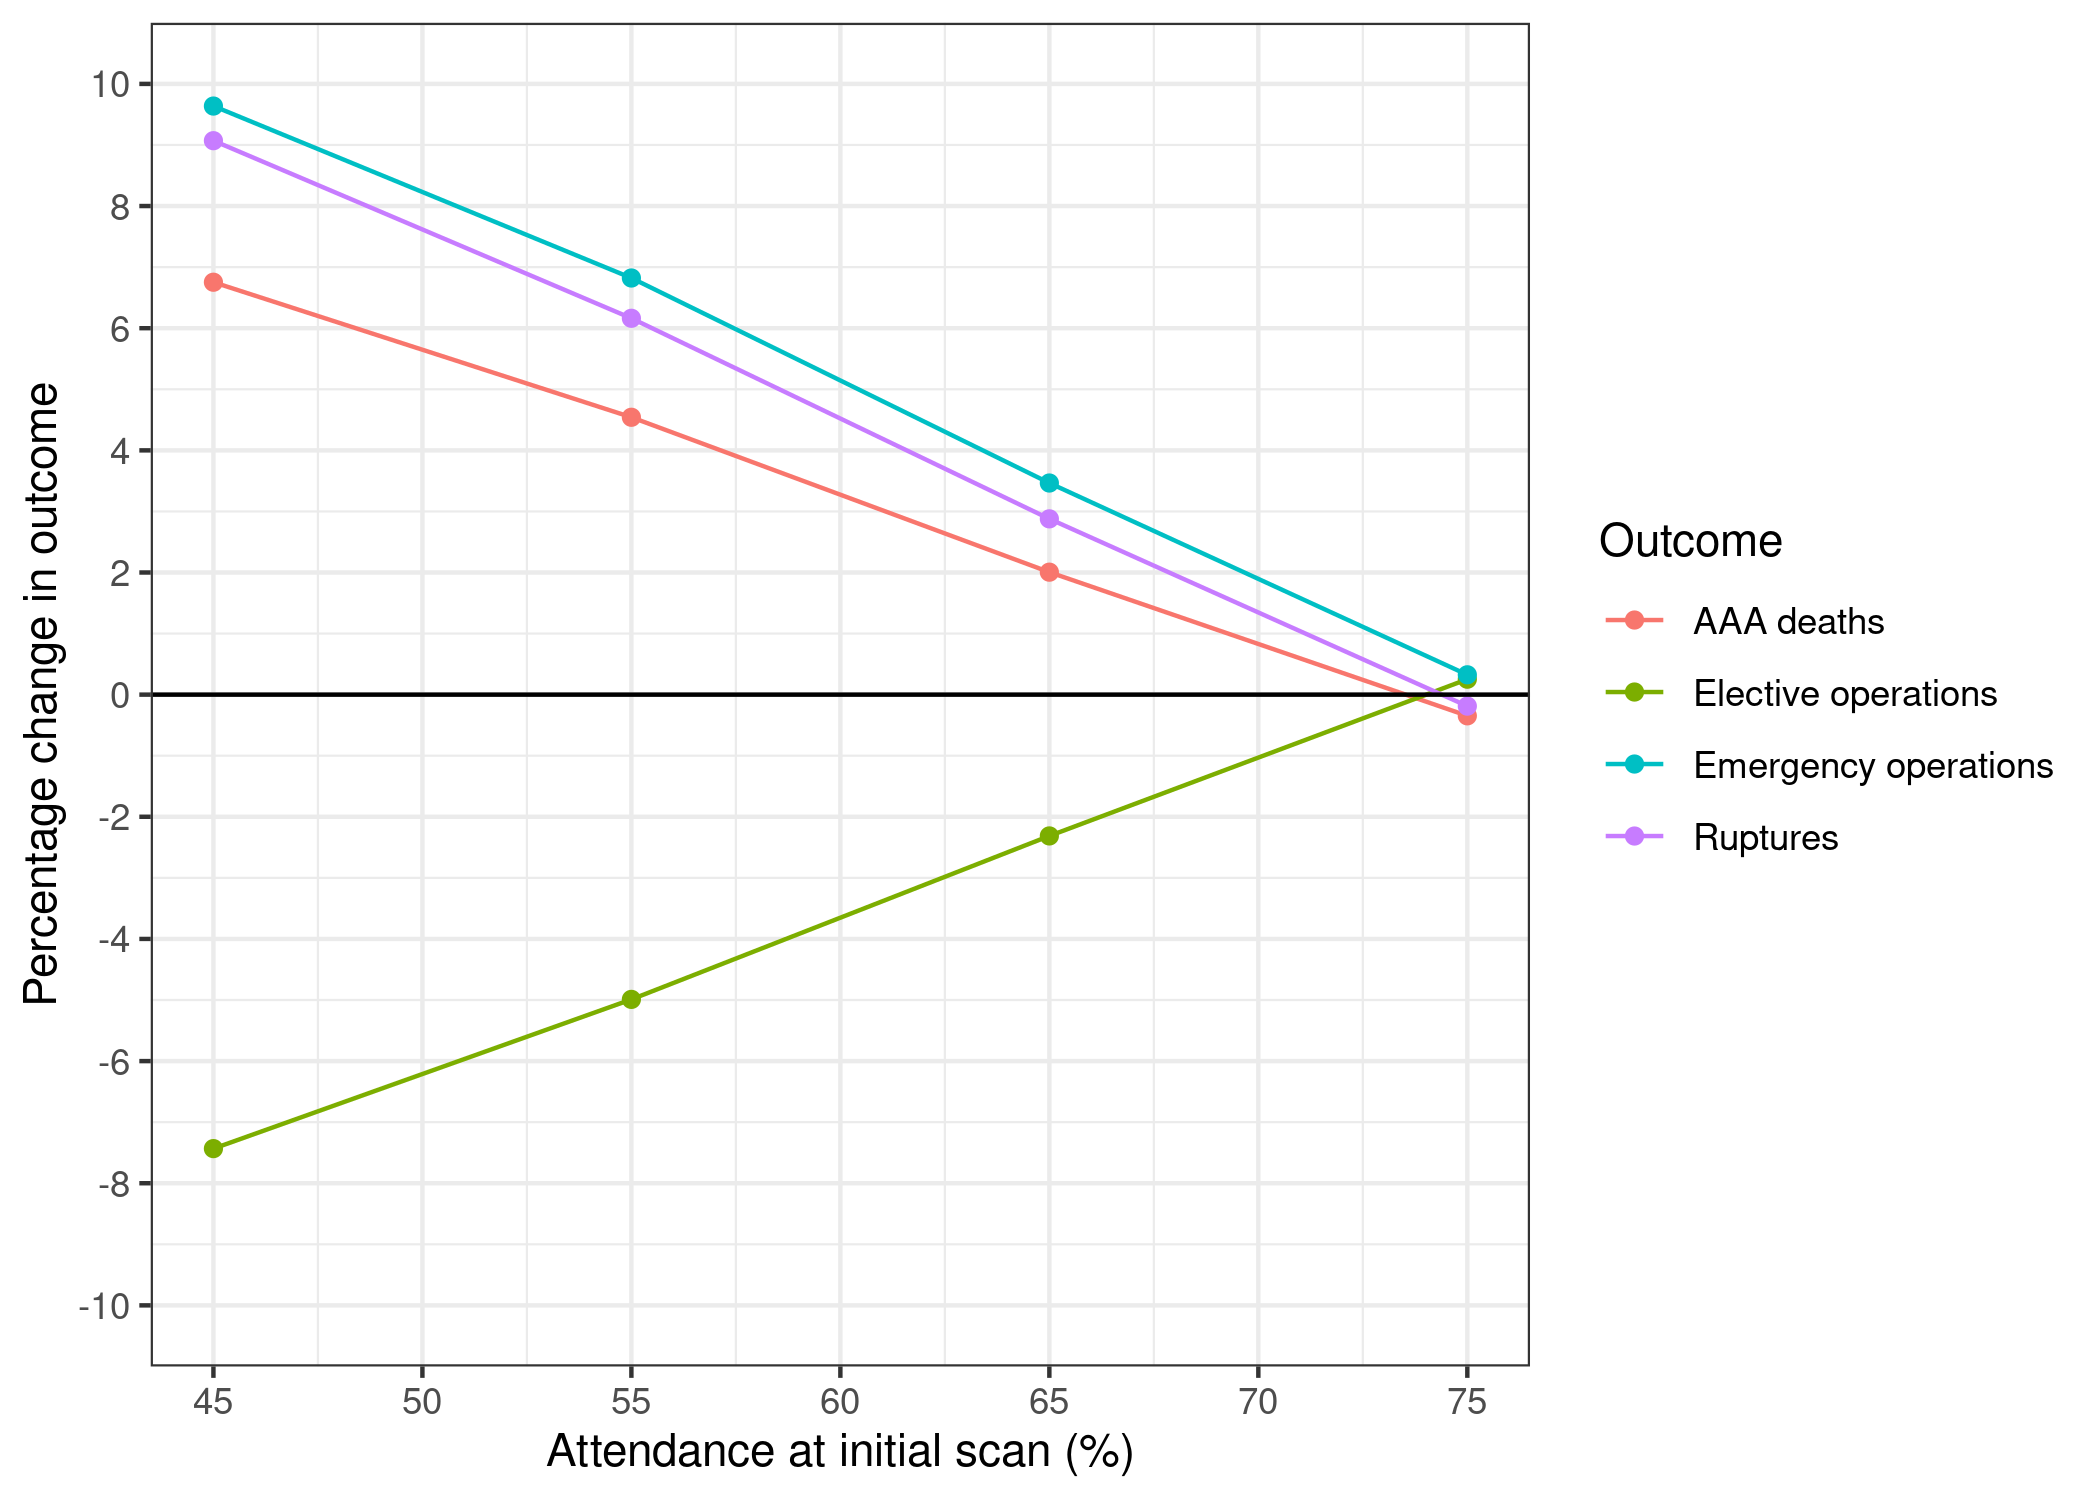
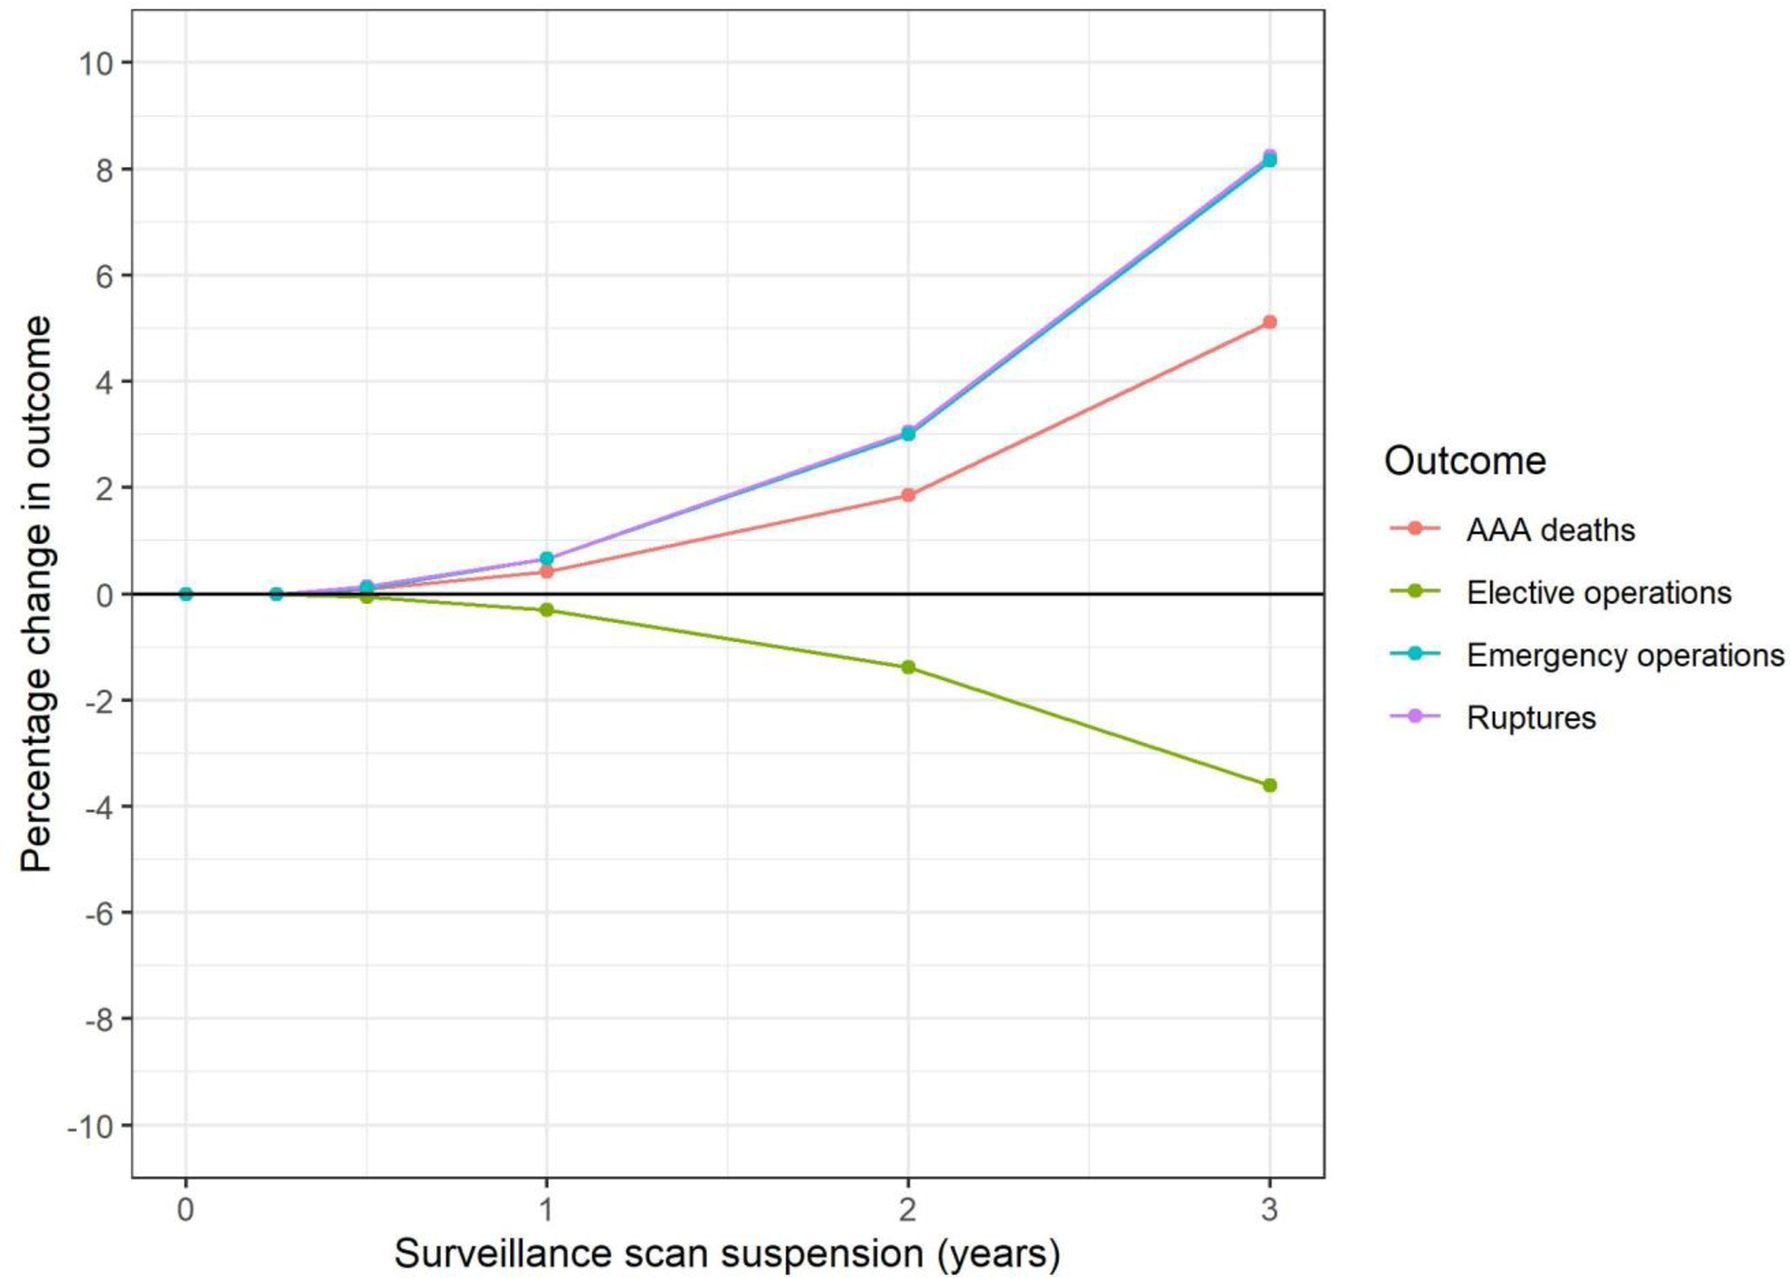
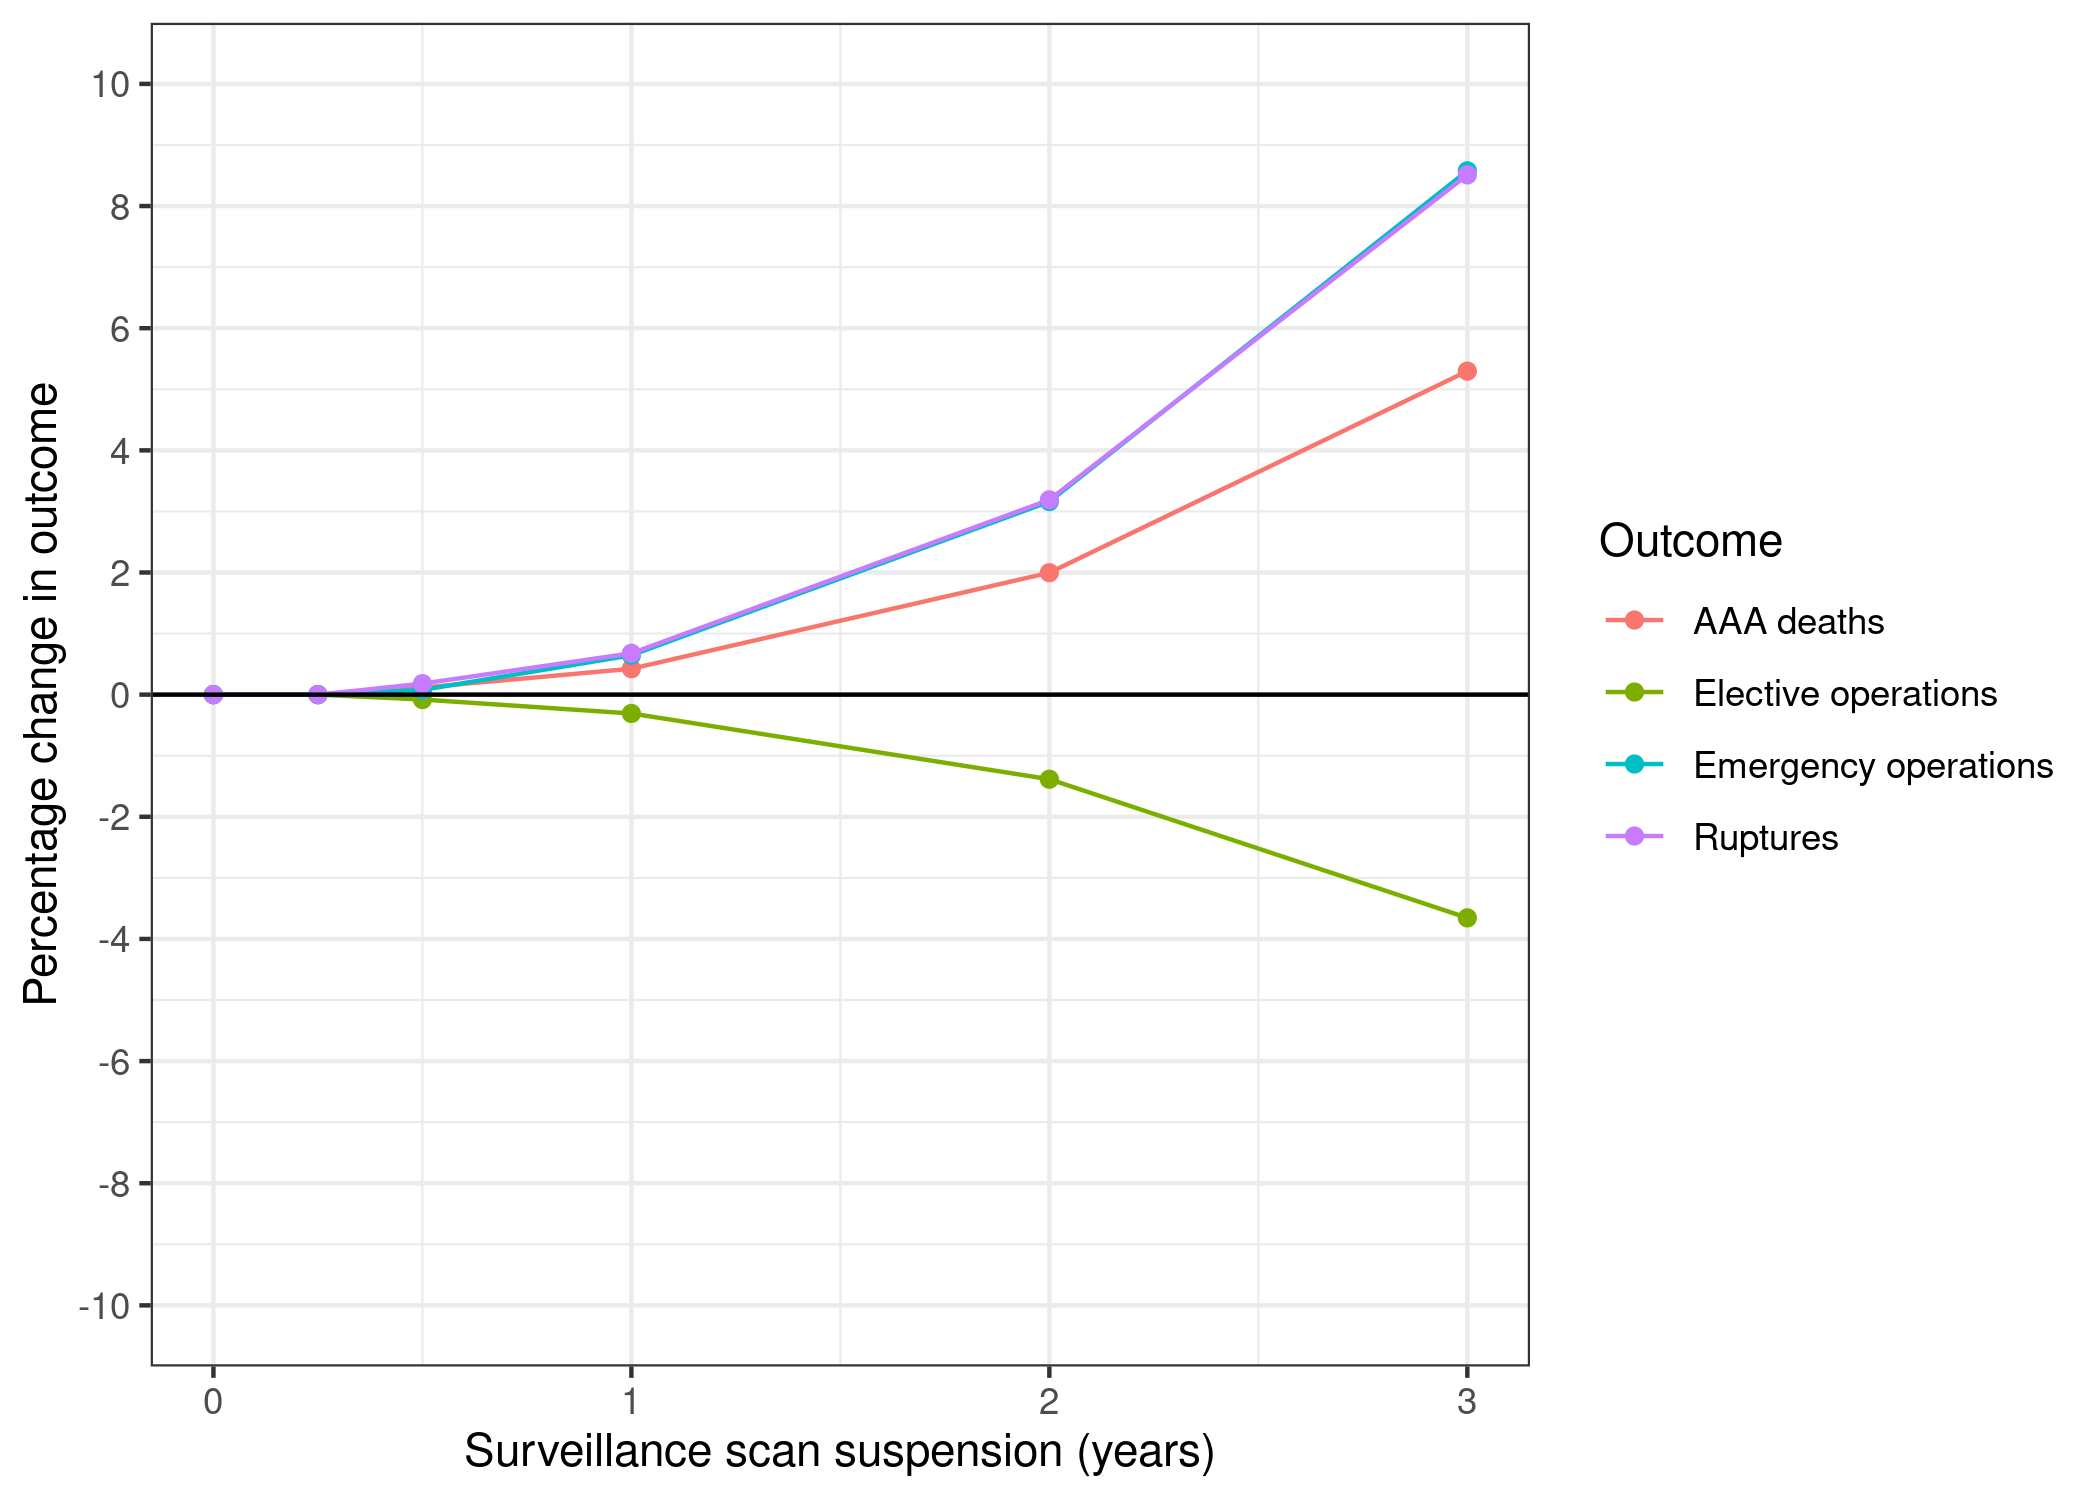
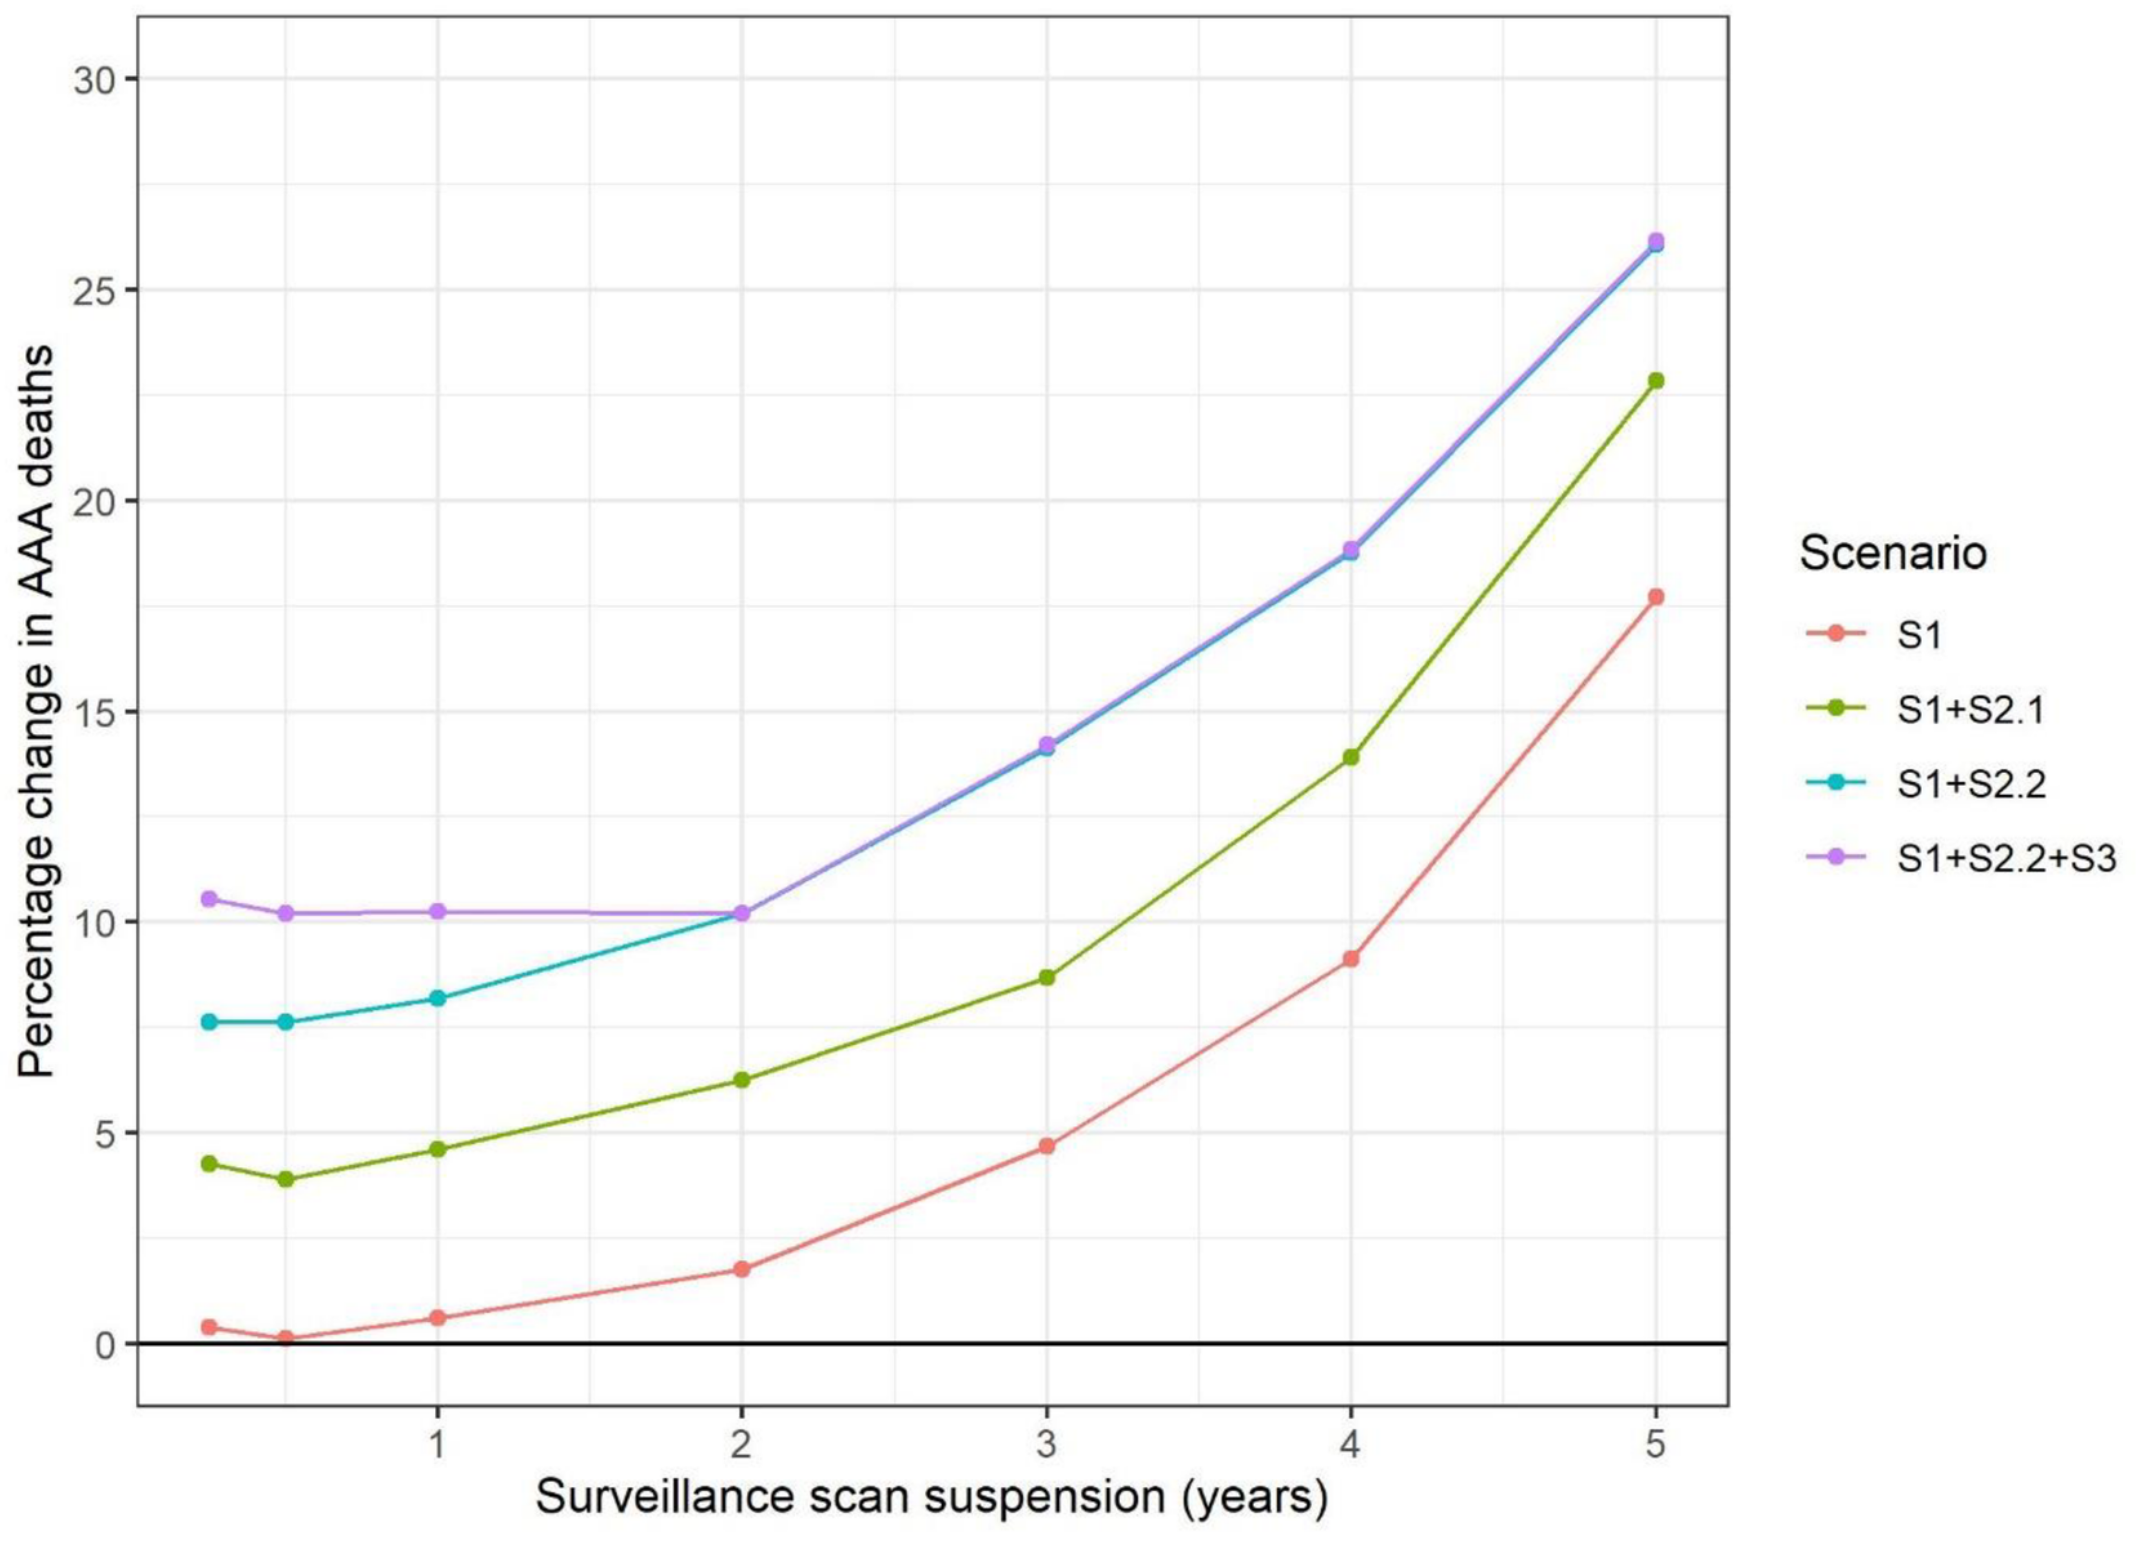
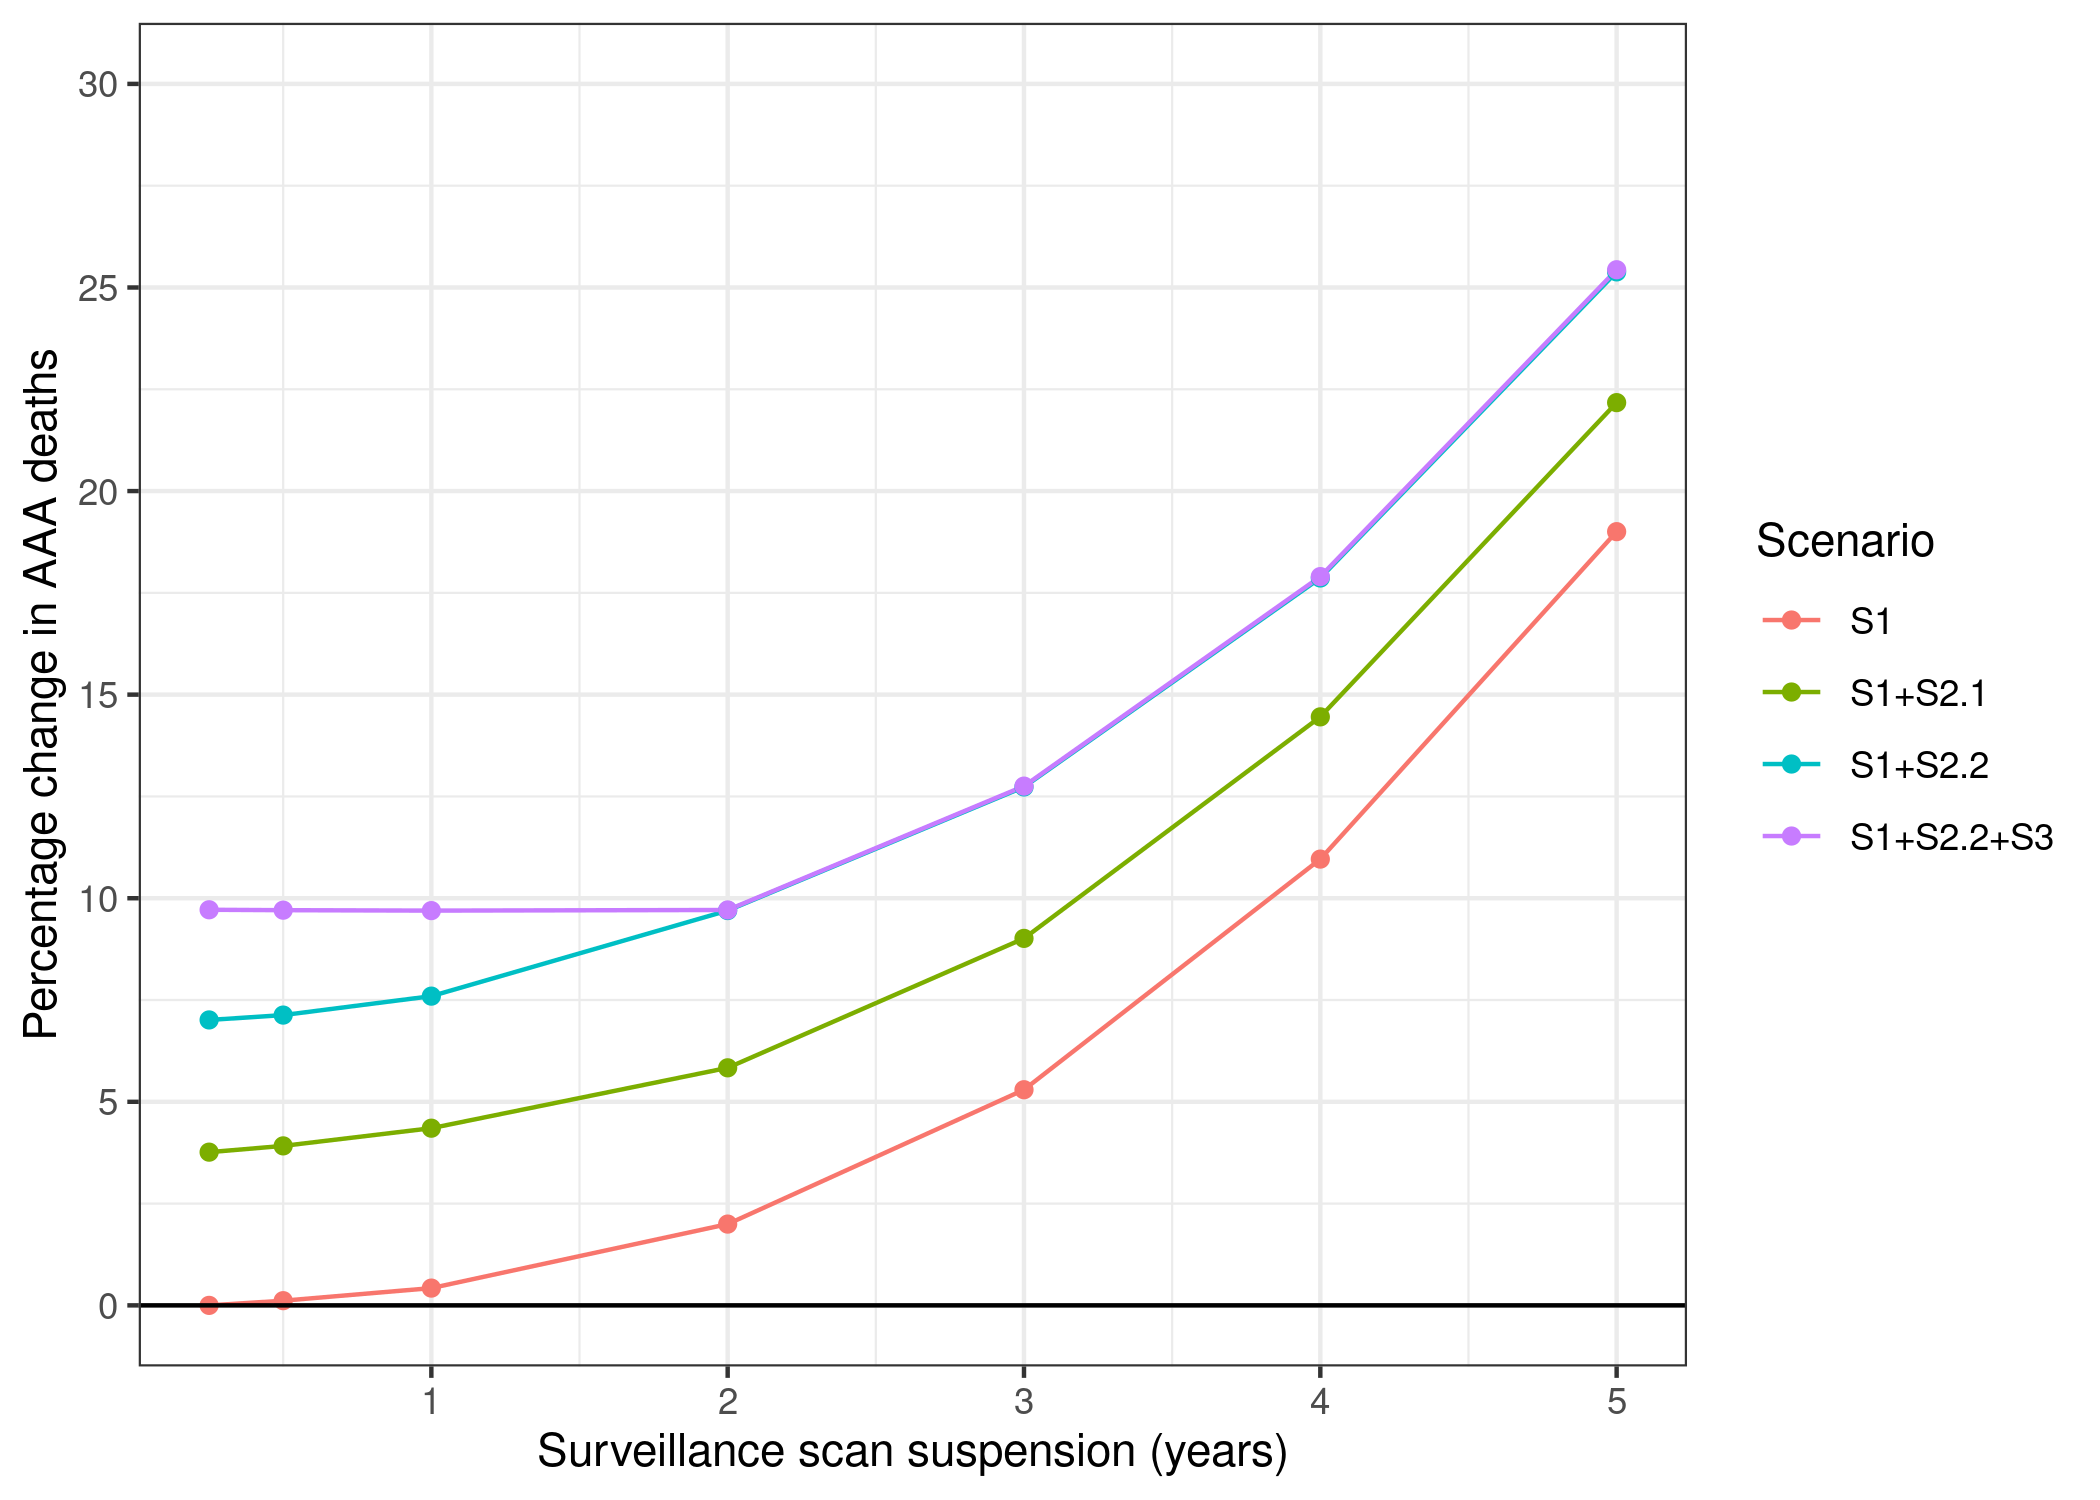
Figure 3
Consensus: Successfully reproduced
Original (Kim et al. (2021)):
Reproduction:
In-text result 1
Consensus: Successfully reproduced
In bold are the items not captured in Table 3 or Figure 3:
“Suspending ultrasound scans in the surveillance cohort could result in 9 (0.4% increase) additional AAA-related deaths if scans were suspended for one year (Table 3, Fig 3). Of these, 2 (1% increase) are in the sub-group measuring 4.5–4.9 cm at the start of the pandemic and 7 (8% increase) in the sub-group measuring 5.0–5.4 cm; <0.1 are in the 3.0–4.4 cm sub-group. More pronounced effects are evident for suspension for two years and beyond. Suspending surveillance for two years could result in 40 excess AAA-related deaths overall; a 1.9% increase over the lifetime of the surveillance cohort. Of these, 1 is in the 3.0–4.4 cm sub-group and 17 (7% increase) in the 4.5–4.9cm sub-group. However, the remaining 22 excess deaths are in the 5.0–5.4cm range, corresponding to a 24% increase in AAA-related deaths in this sub-group.”
Reproduction:
| years_of_surveillance_suspension | aorta_size | dead_scaled | extra_deaths | pct_change | |
|---|---|---|---|---|---|
| 0 | 0 | small | 1750 | 0 | 0.00 |
| 1 | 0 | med | 225 | 0 | 0.00 |
| 2 | 0 | large | 180 | 0 | 0.00 |
| 3 | 1 | small | 1750 | 0 | 0.00 |
| 4 | 1 | med | 227 | 2 | 0.89 |
| 5 | 1 | large | 187 | 7 | 3.89 |
| 6 | 2 | small | 1755 | 5 | 0.29 |
| 7 | 2 | med | 235 | 10 | 4.44 |
| 8 | 2 | large | 207 | 27 | 15.00 |
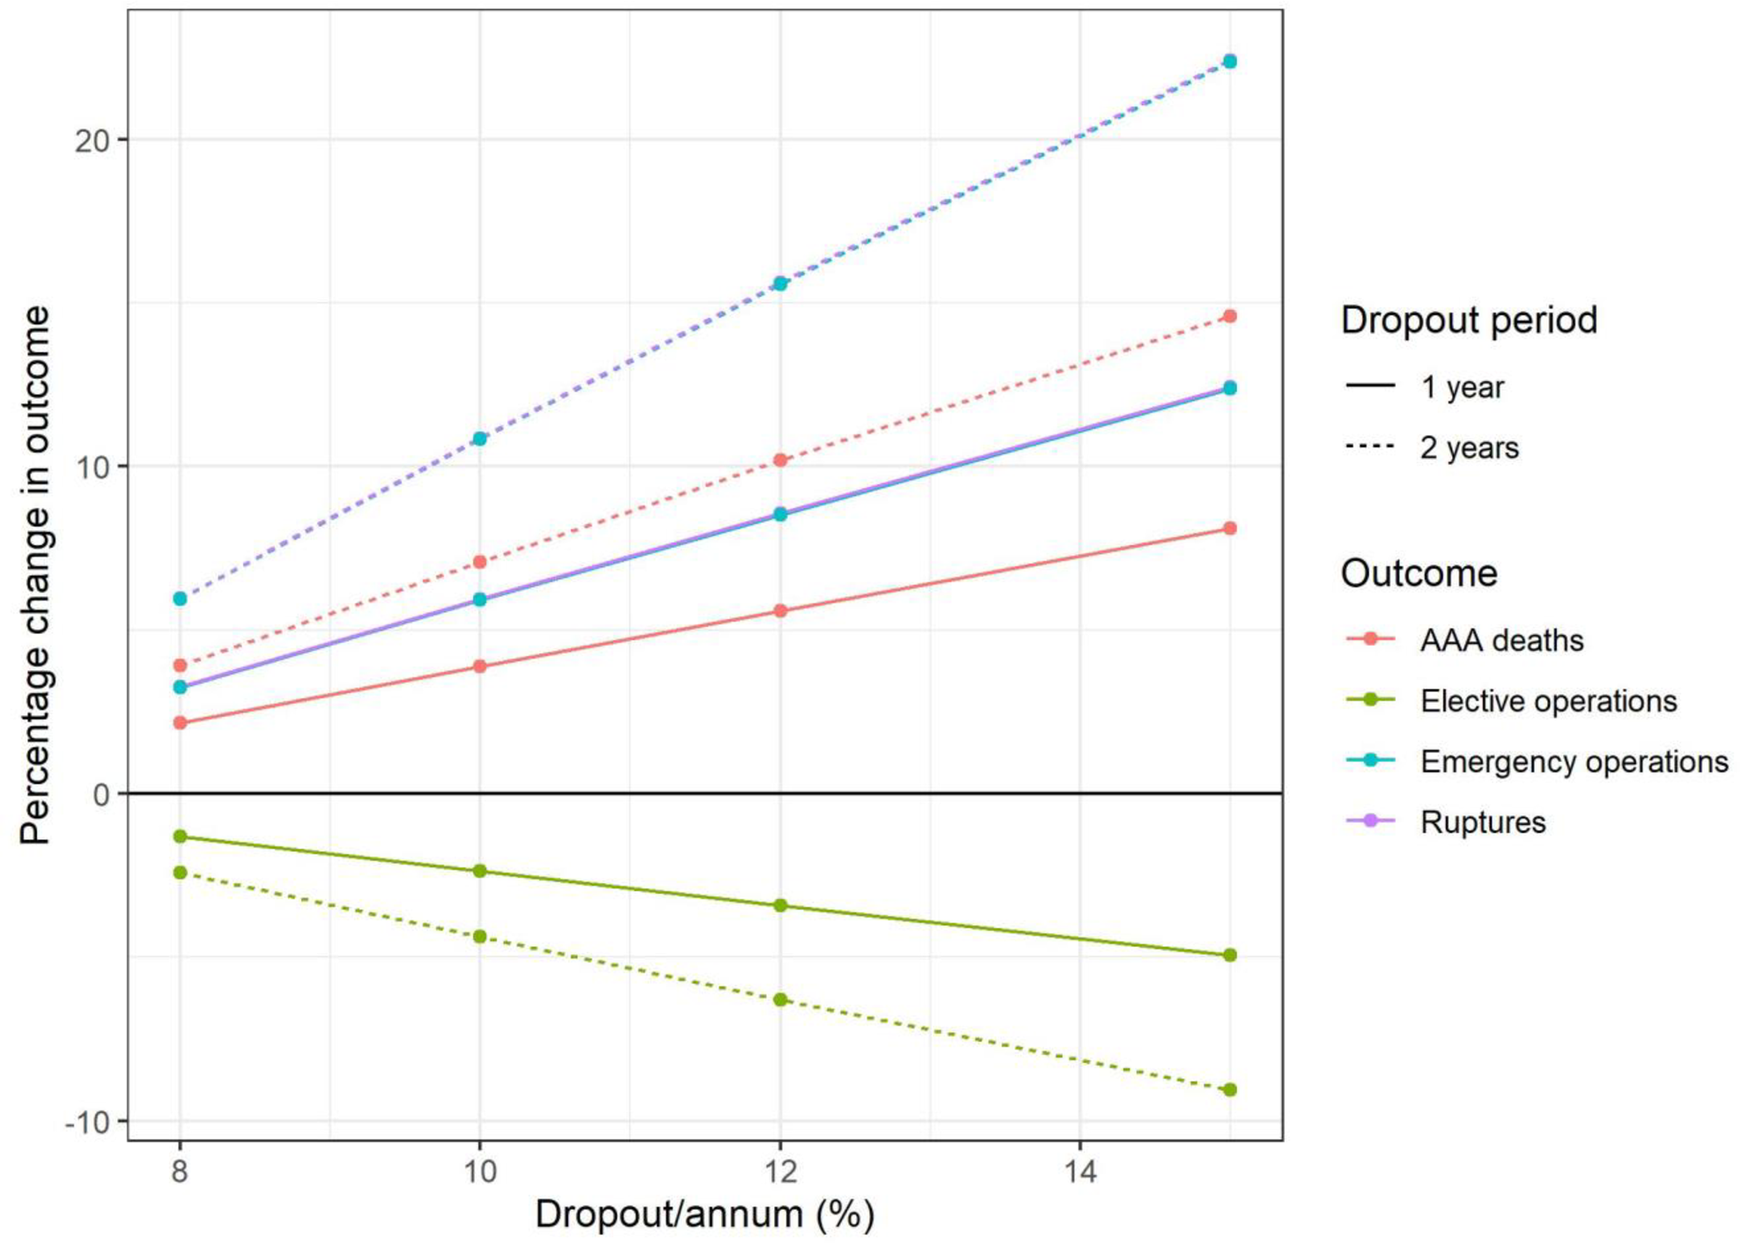
Figure 4
Consensus: Successfully reproduced
Original (Kim et al. (2021)):
Reproduction:
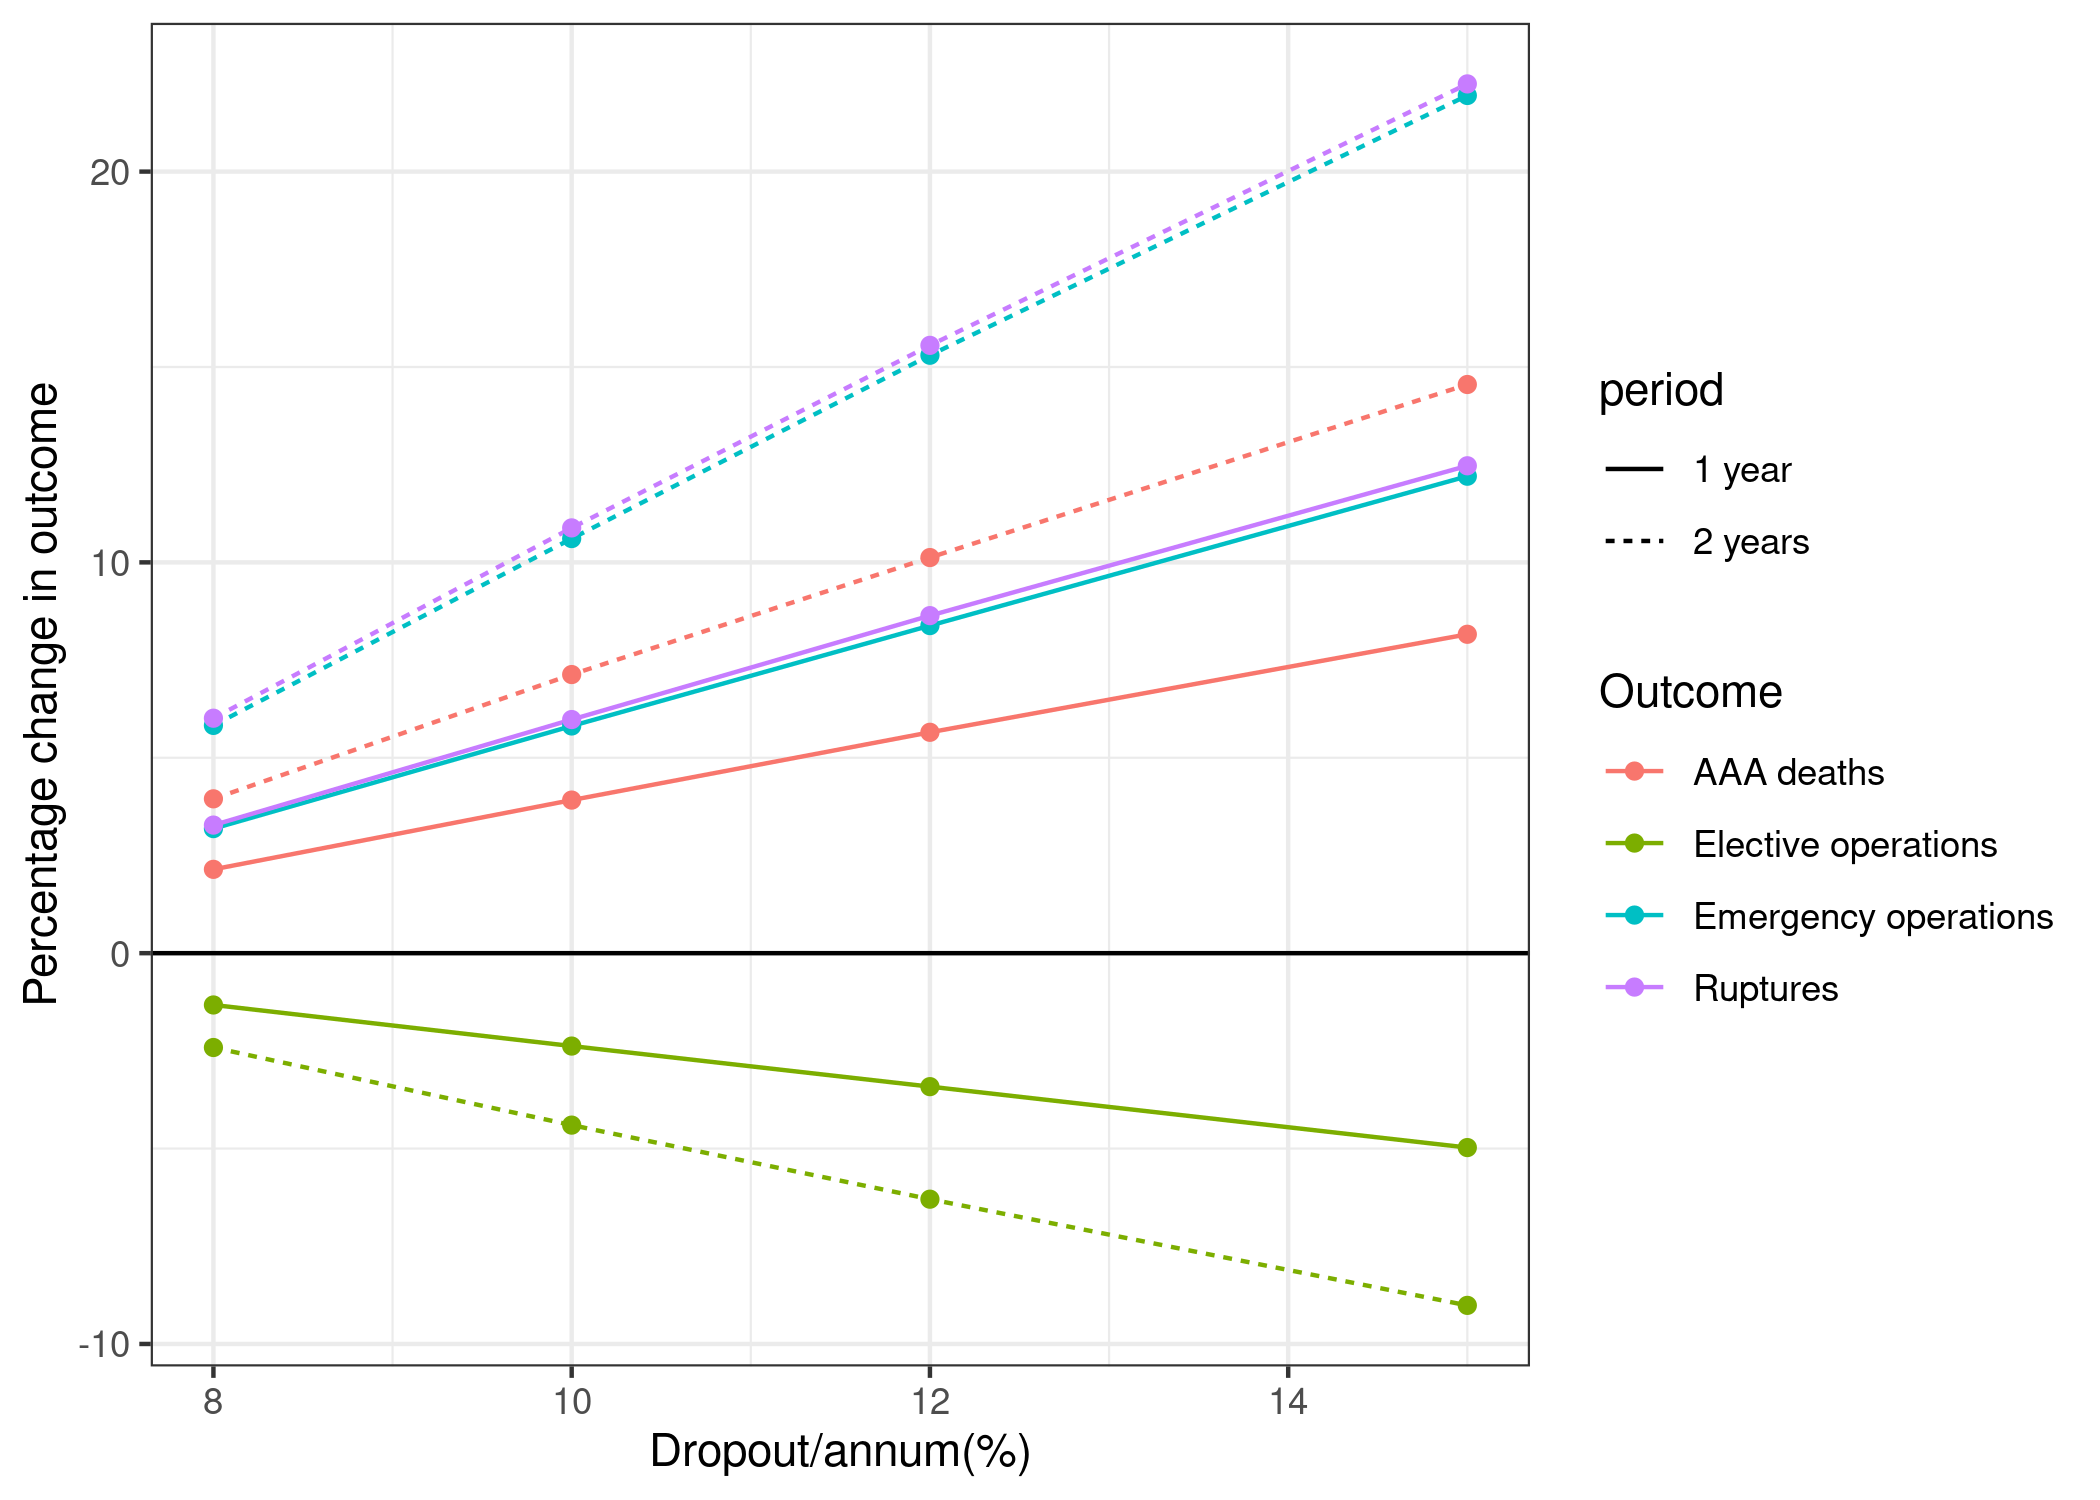
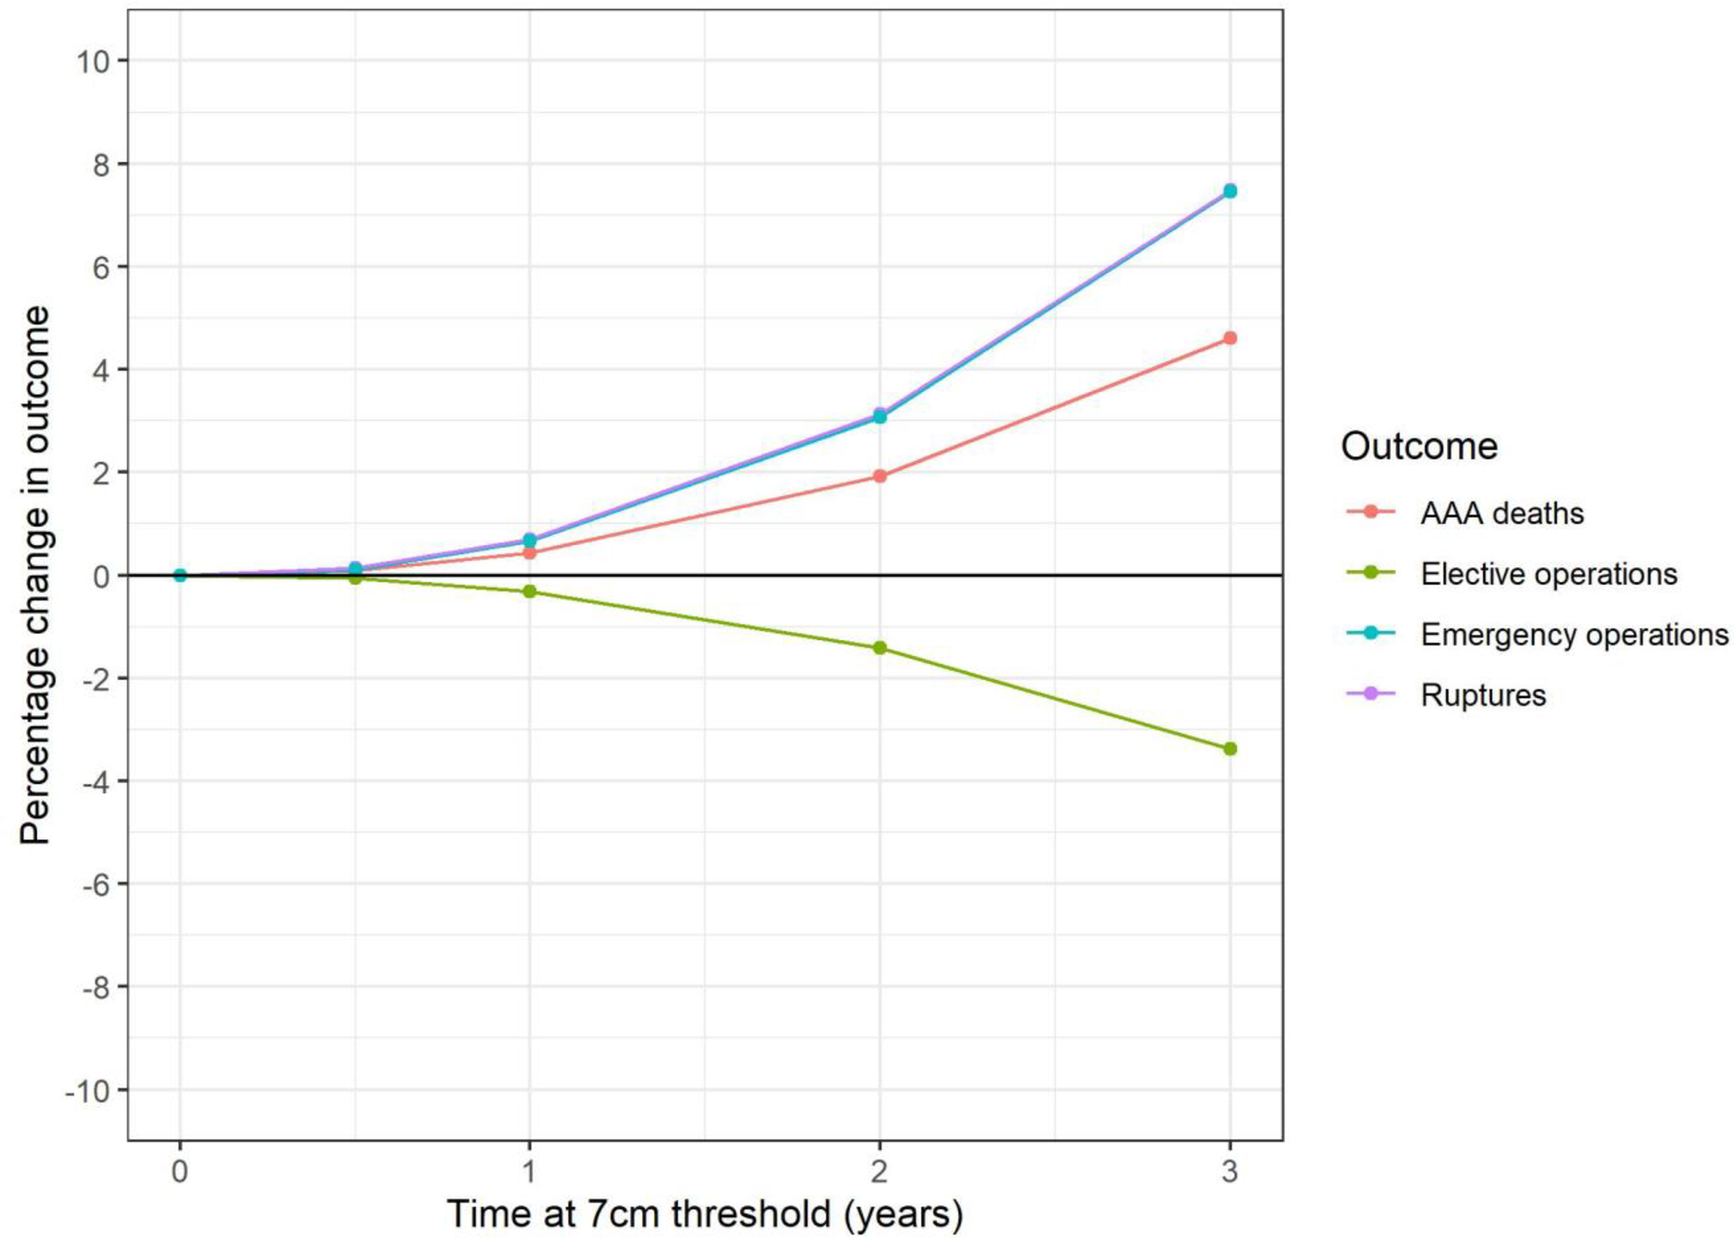
Figure 5
Consensus: Successfully reproduced
Original (Kim et al. (2021)):
Reproduction:
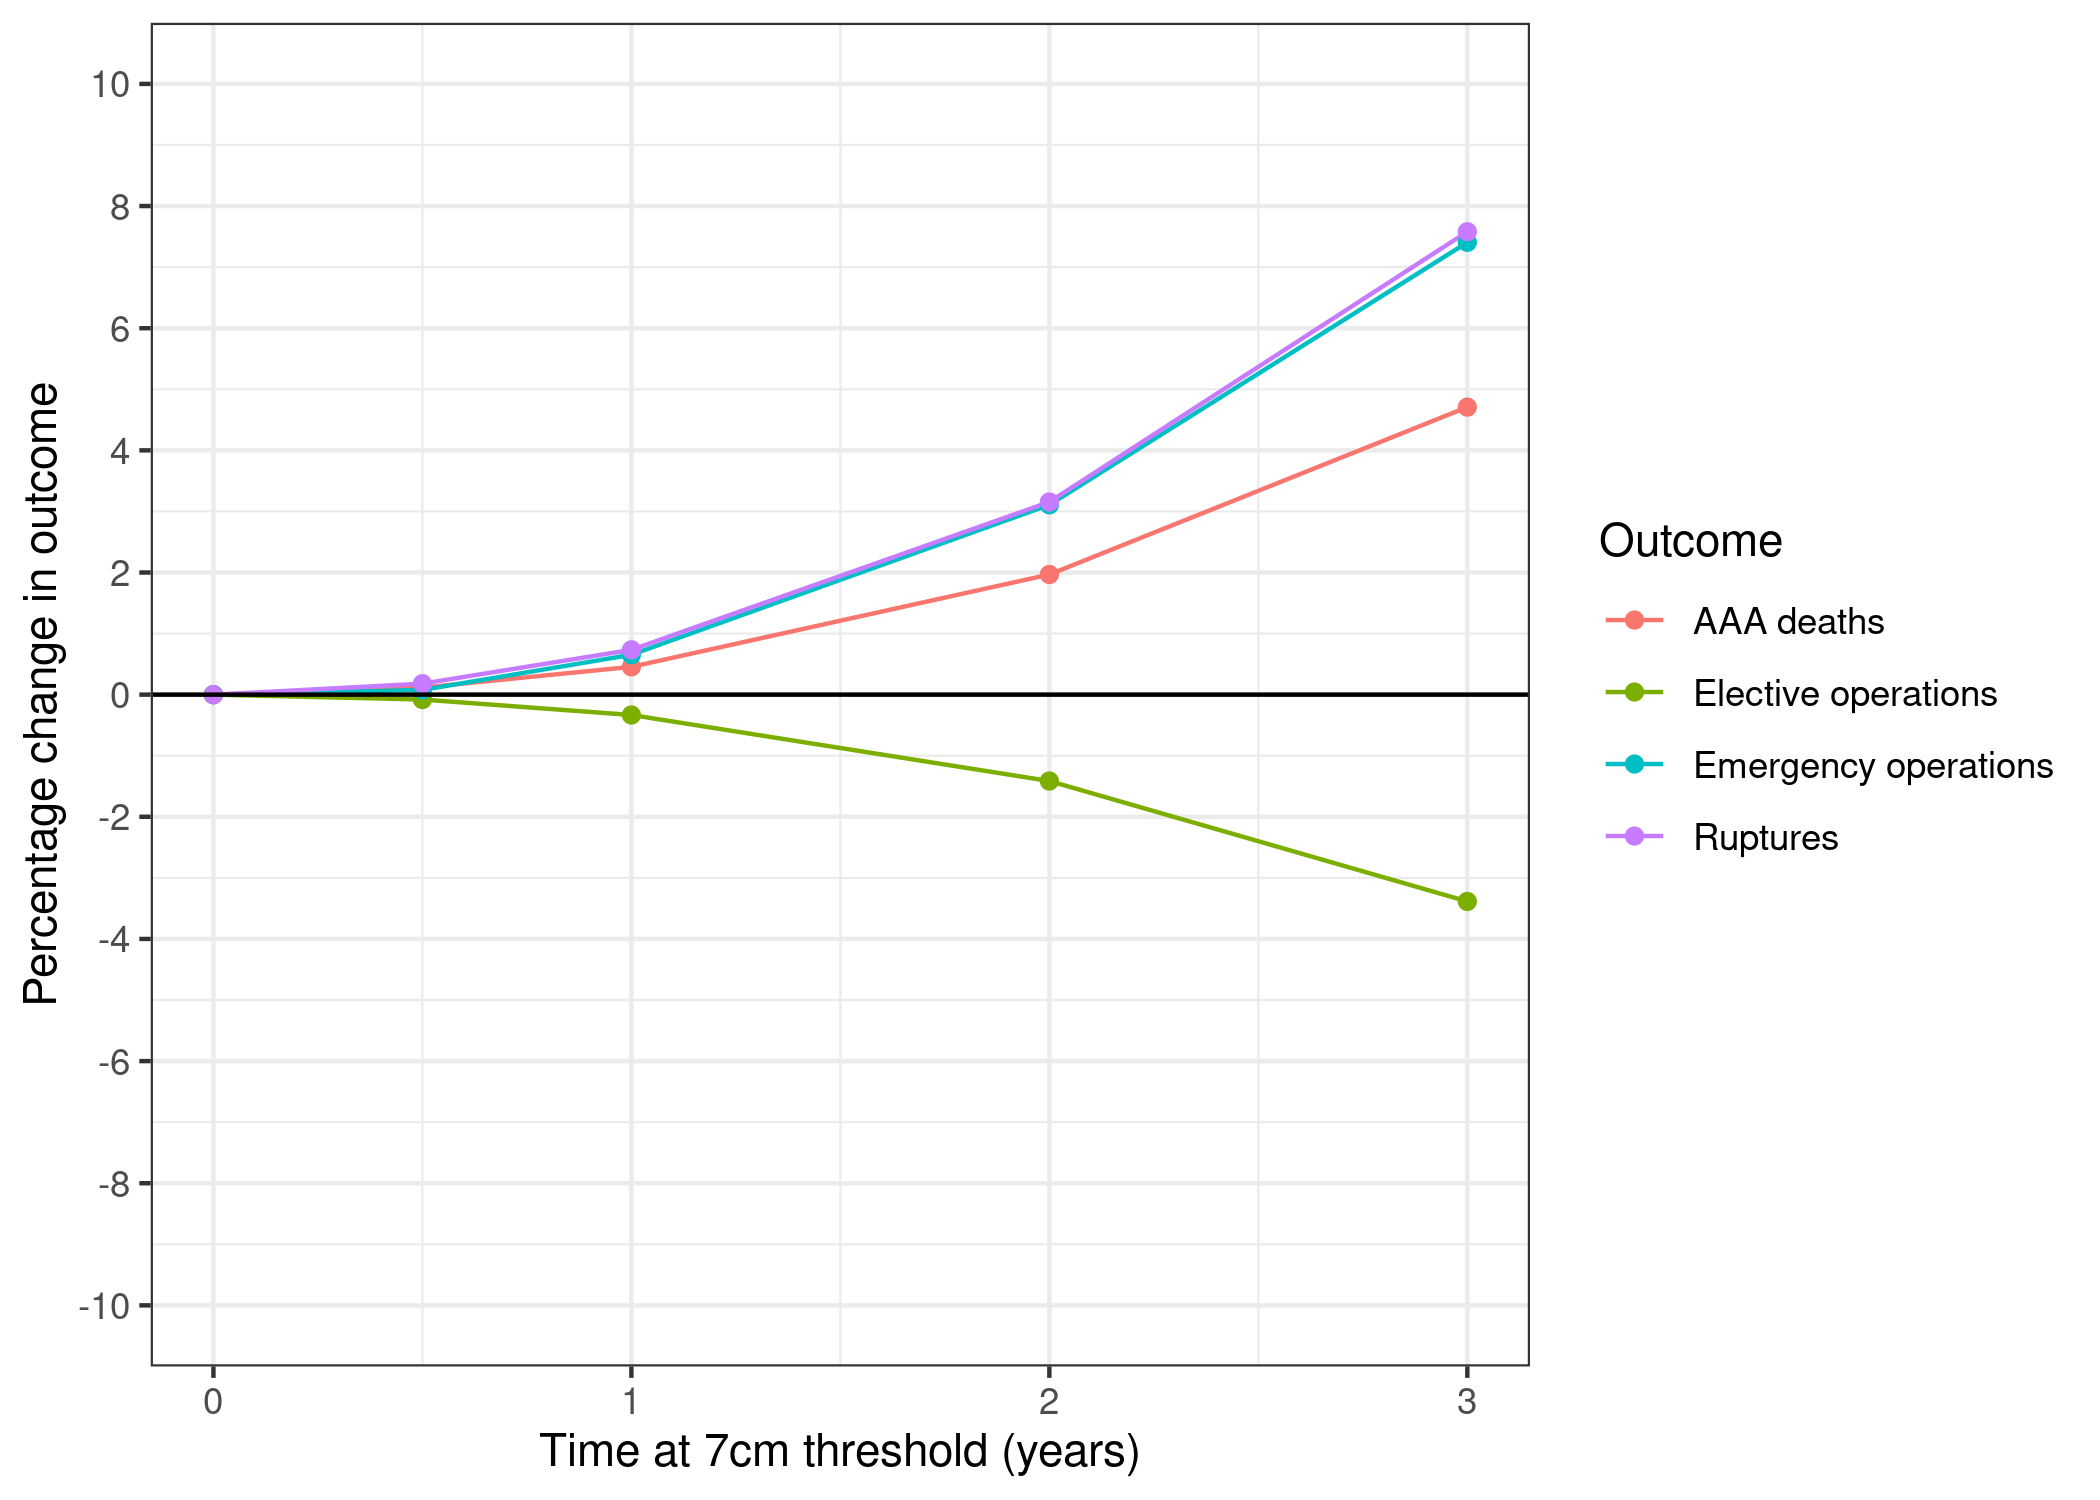
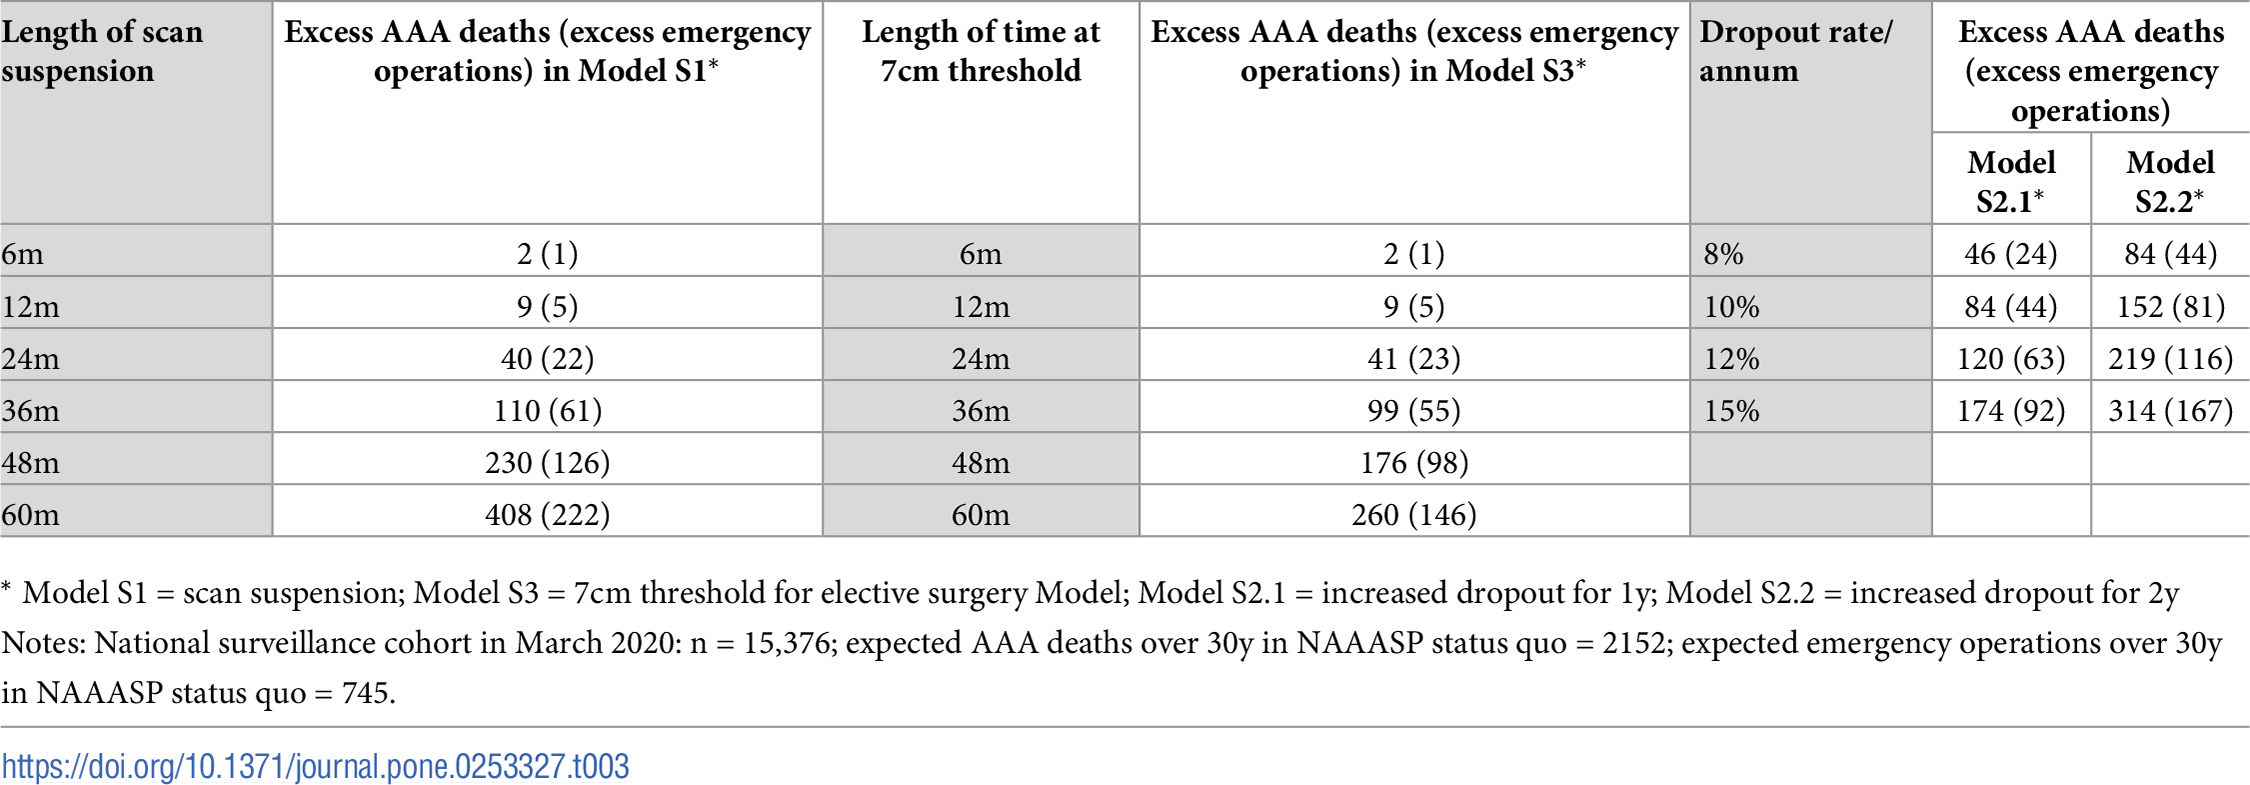
Table 3
Consensus: Successfully reproduced
Original (Kim et al. (2021)):
Reproduction:
| Length of scan suspension | Excess AAA deaths (excess emergency operations) in Model S1 | Length of time at 7cm threshold | Excess AAA deaths (excess emergency operations) in Model S3 | Dropout rate/ annum | Excess AAA deaths (excess emergency operations) in Model S2.1 | Excess AAA deaths (excess emergency operations) in Model S2.2 | |
|---|---|---|---|---|---|---|---|
| 0 | 6m | 2 (0) | 6m | 2 (0) | 8% | 46 (24) | 85 (43) |
| 1 | 12m | 9 (4) | 12m | 10 (4) | 10% | 84 (43) | 153 (79) |
| 2 | 24m | 43 (23) | 24m | 42 (23) | 12% | 122 (62) | 218 (114) |
| 3 | 36m | 114 (64) | 36m | 101 (55) | 15% | 176 (91) | 313 (164) |
| 4 | 48m | 236 (127) | 48m | 179 (98) | NaN | NaN | NaN |
| 5 | 60m | 409 (223) | 60m | 262 (146) | NaN | NaN | NaN |
Supplementary figure 3
Consensus: Successfully reproduced
Original (Kim et al. (2021)):
Reproduction:
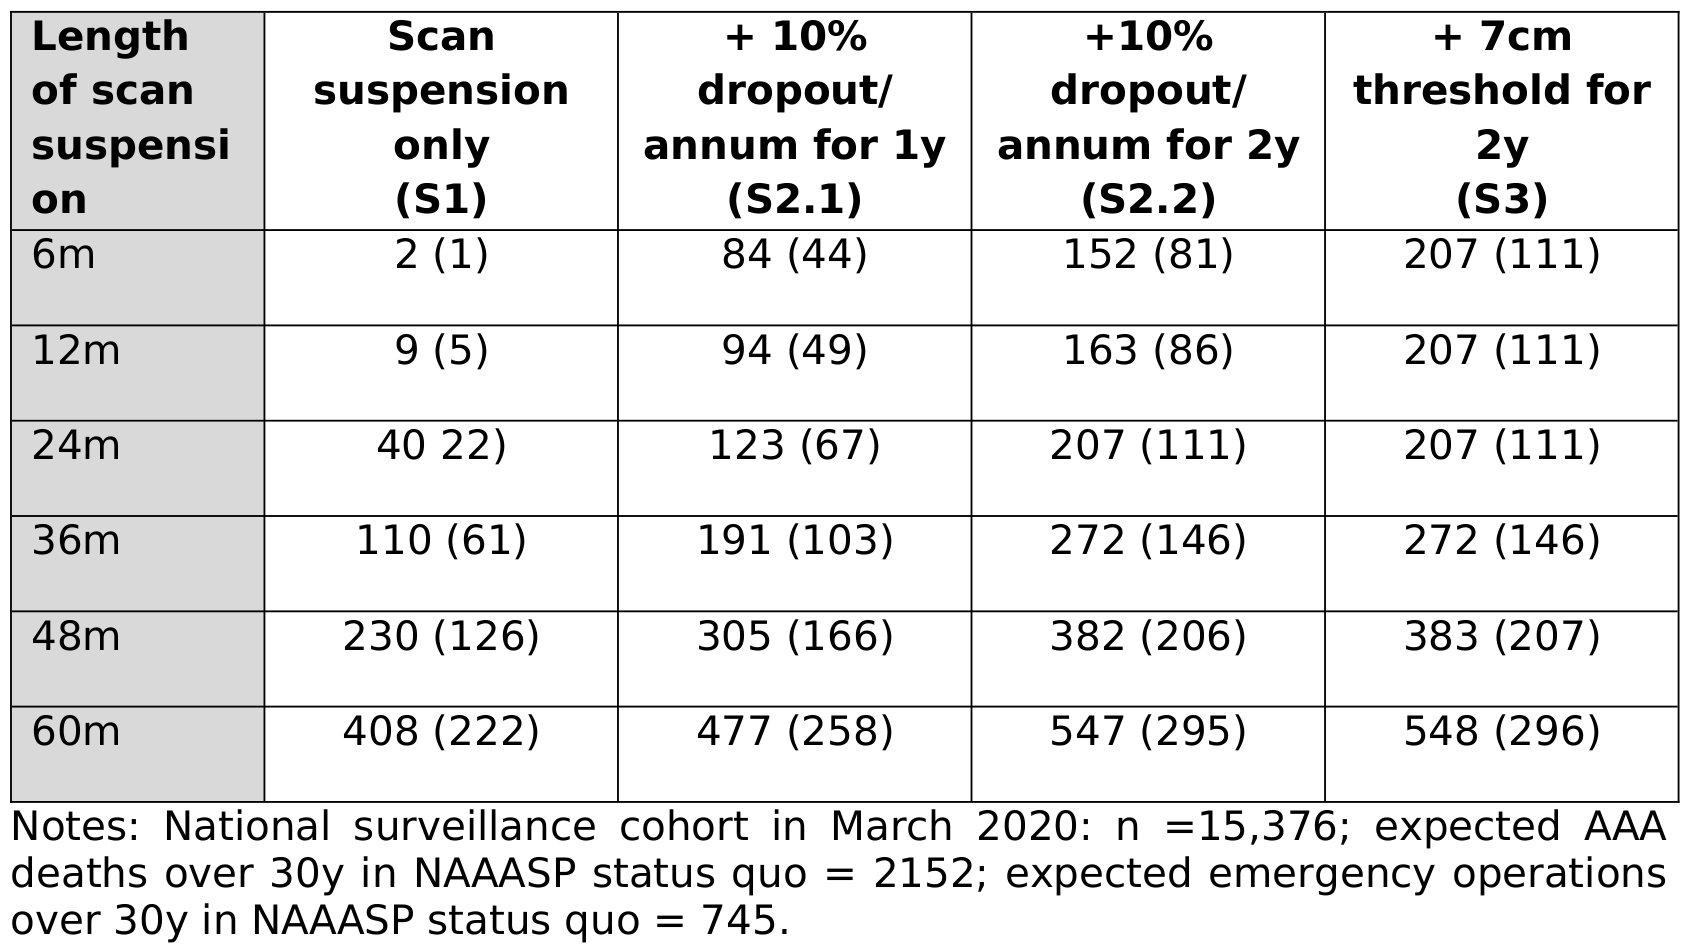
Supplementary table 2
Consensus: Successfully reproduced
Original (Kim et al. (2021)):
Reproduction:
| Length of scan suspension | Scan suspension only (S1) | +10% dropout/ annum for 1y (S2.1) | +10% dropout/ annum for 2y (S2.2) | +7cm threshold for 2y (S3) | |
|---|---|---|---|---|---|
| 0 | 6m | 2 (0) | 84 (43) | 153 (79) | 209 (111) |
| 1 | 12m | 9 (4) | 94 (49) | 164 (85) | 209 (111) |
| 2 | 24m | 43 (23) | 126 (67) | 209 (112) | 209 (112) |
| 3 | 36m | 114 (64) | 194 (106) | 274 (147) | 275 (148) |
| 4 | 48m | 236 (127) | 311 (166) | 385 (207) | 386 (207) |
| 5 | 60m | 409 (223) | 478 (259) | 547 (297) | 548 (298) |
References
Kim, Lois G., Michael J. Sweeting, Morag Armer, Jo Jacomelli, Akhtar Nasim, and Seamus C. Harrison. 2021. “Modelling the Impact of Changes to Abdominal Aortic Aneurysm Screening and Treatment Services in England During the COVID-19 Pandemic.” PLOS ONE 16 (6): e0253327. https://doi.org/10.1371/journal.pone.0253327.