This page outlines the parts of the journal article which we will attempt to reproduce.
All images and quotes on this page are sourced from Lim et al. (2020)
Within scope
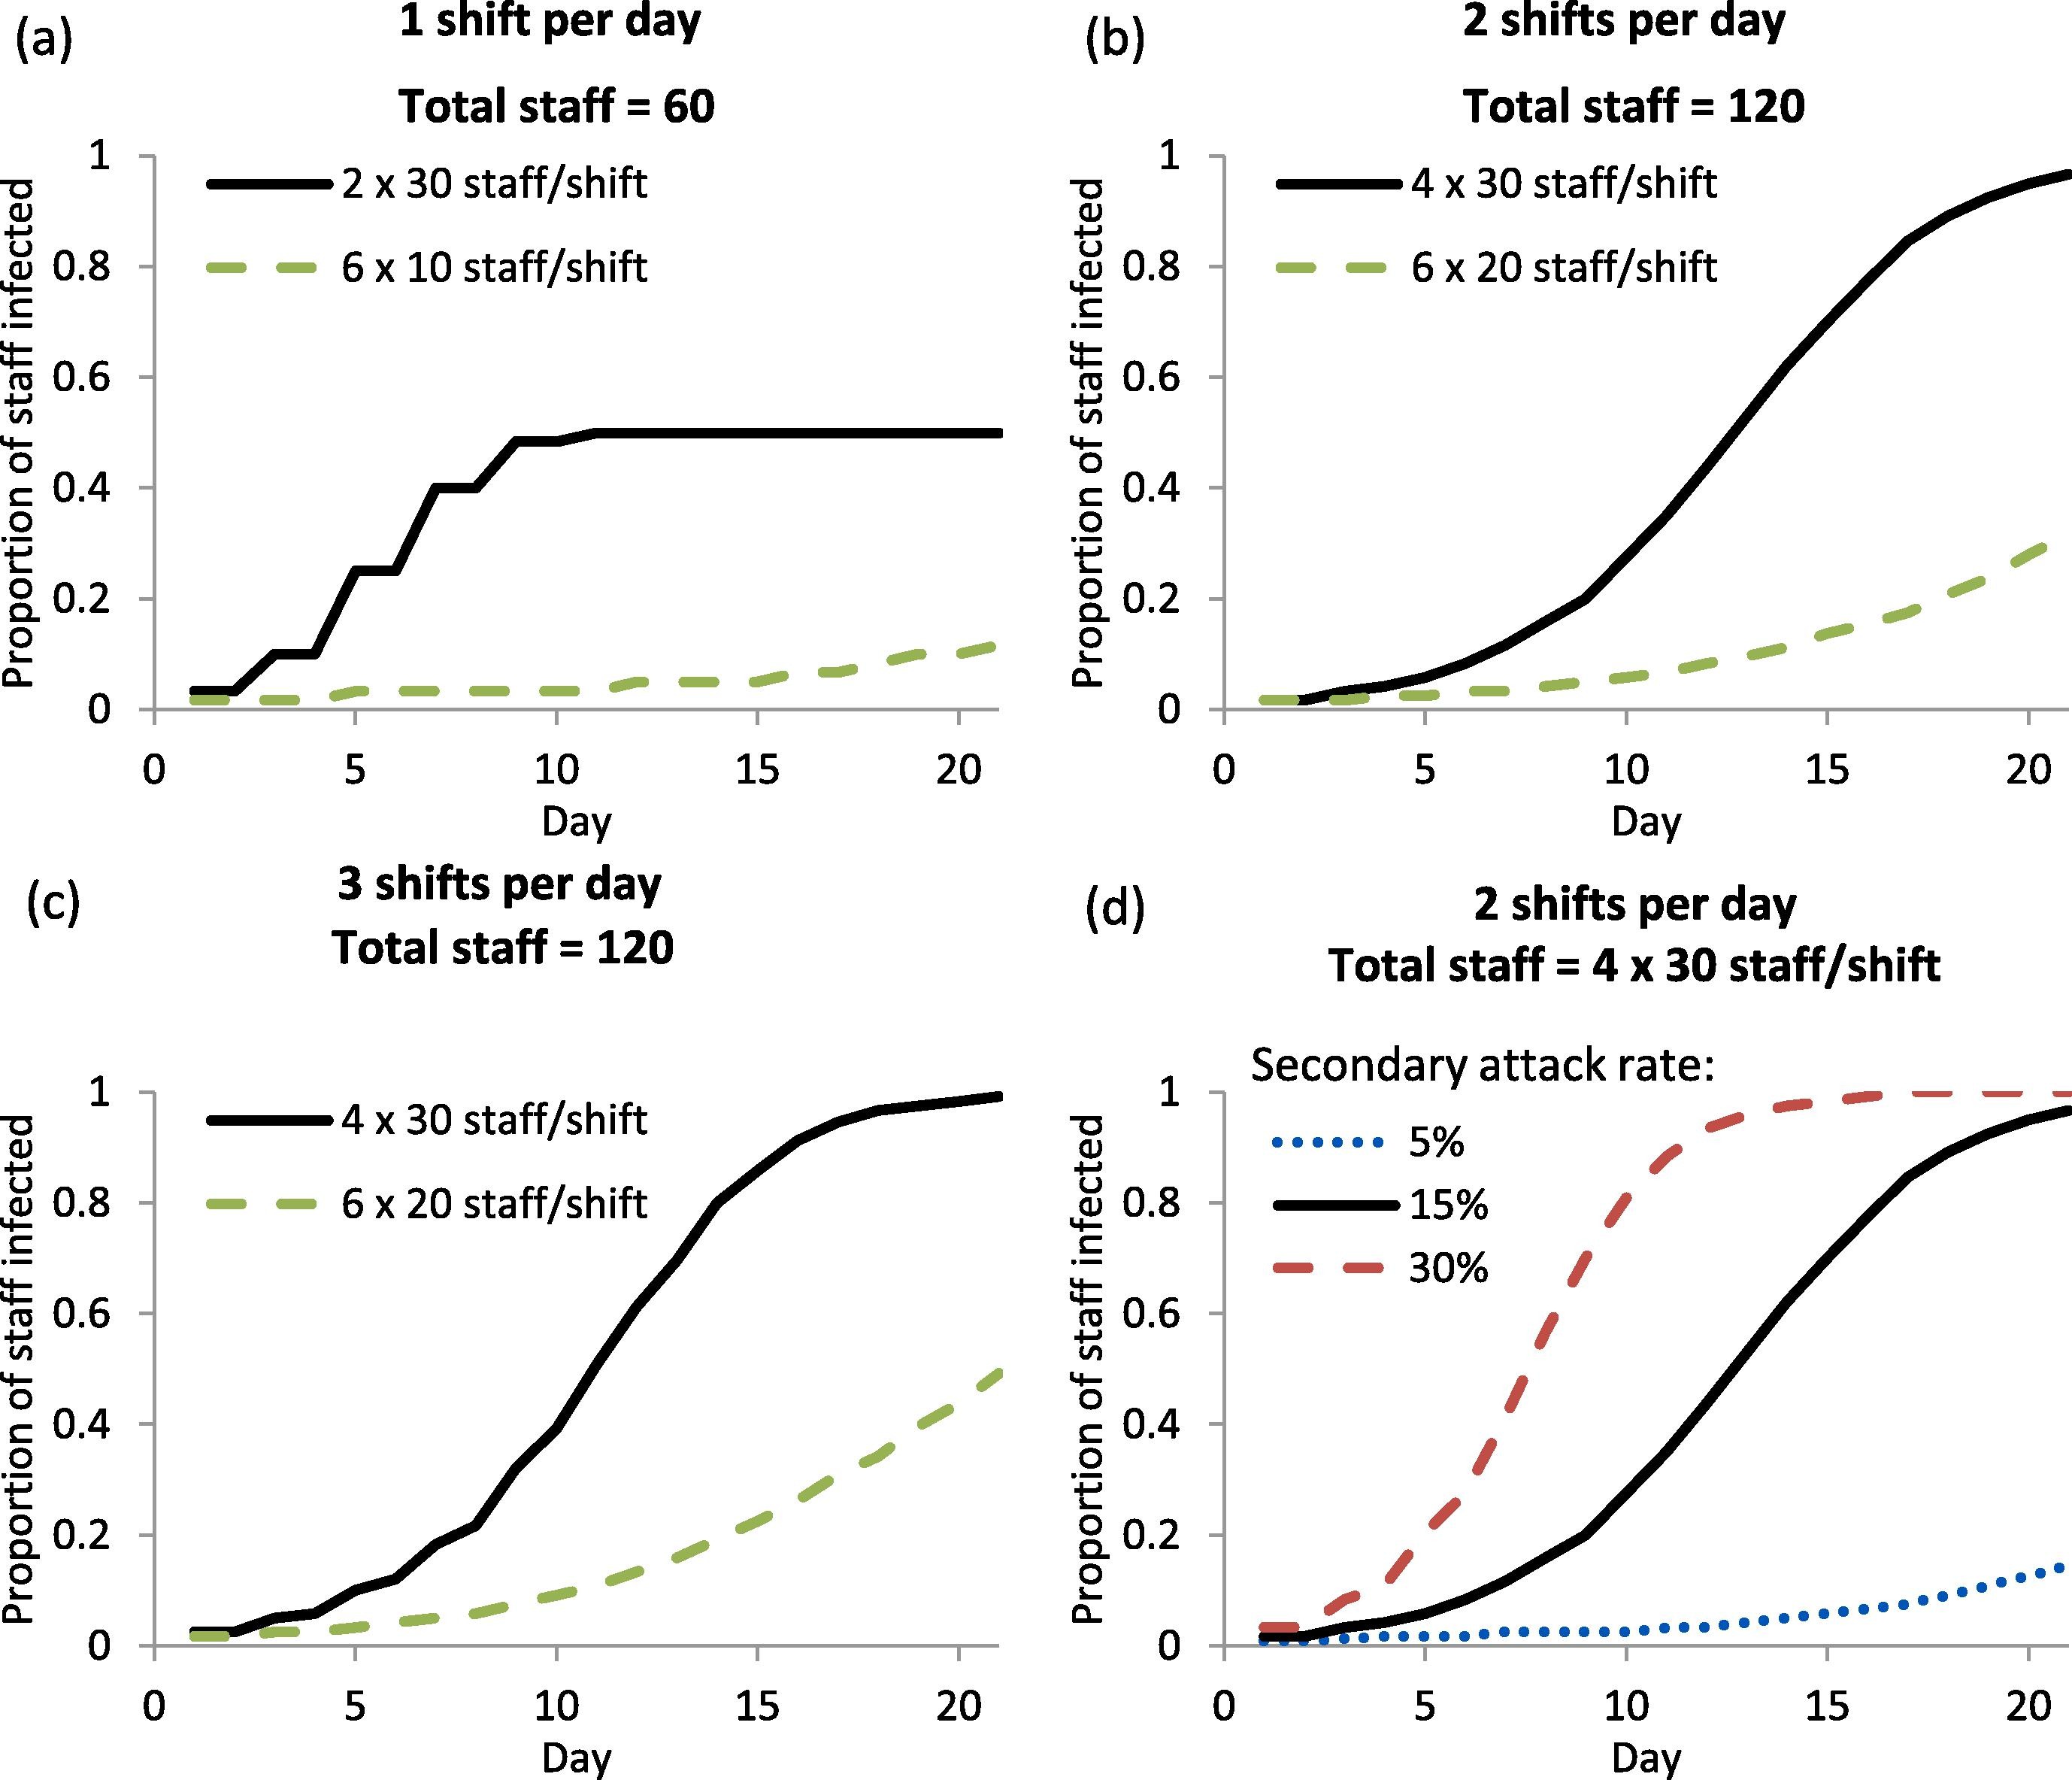
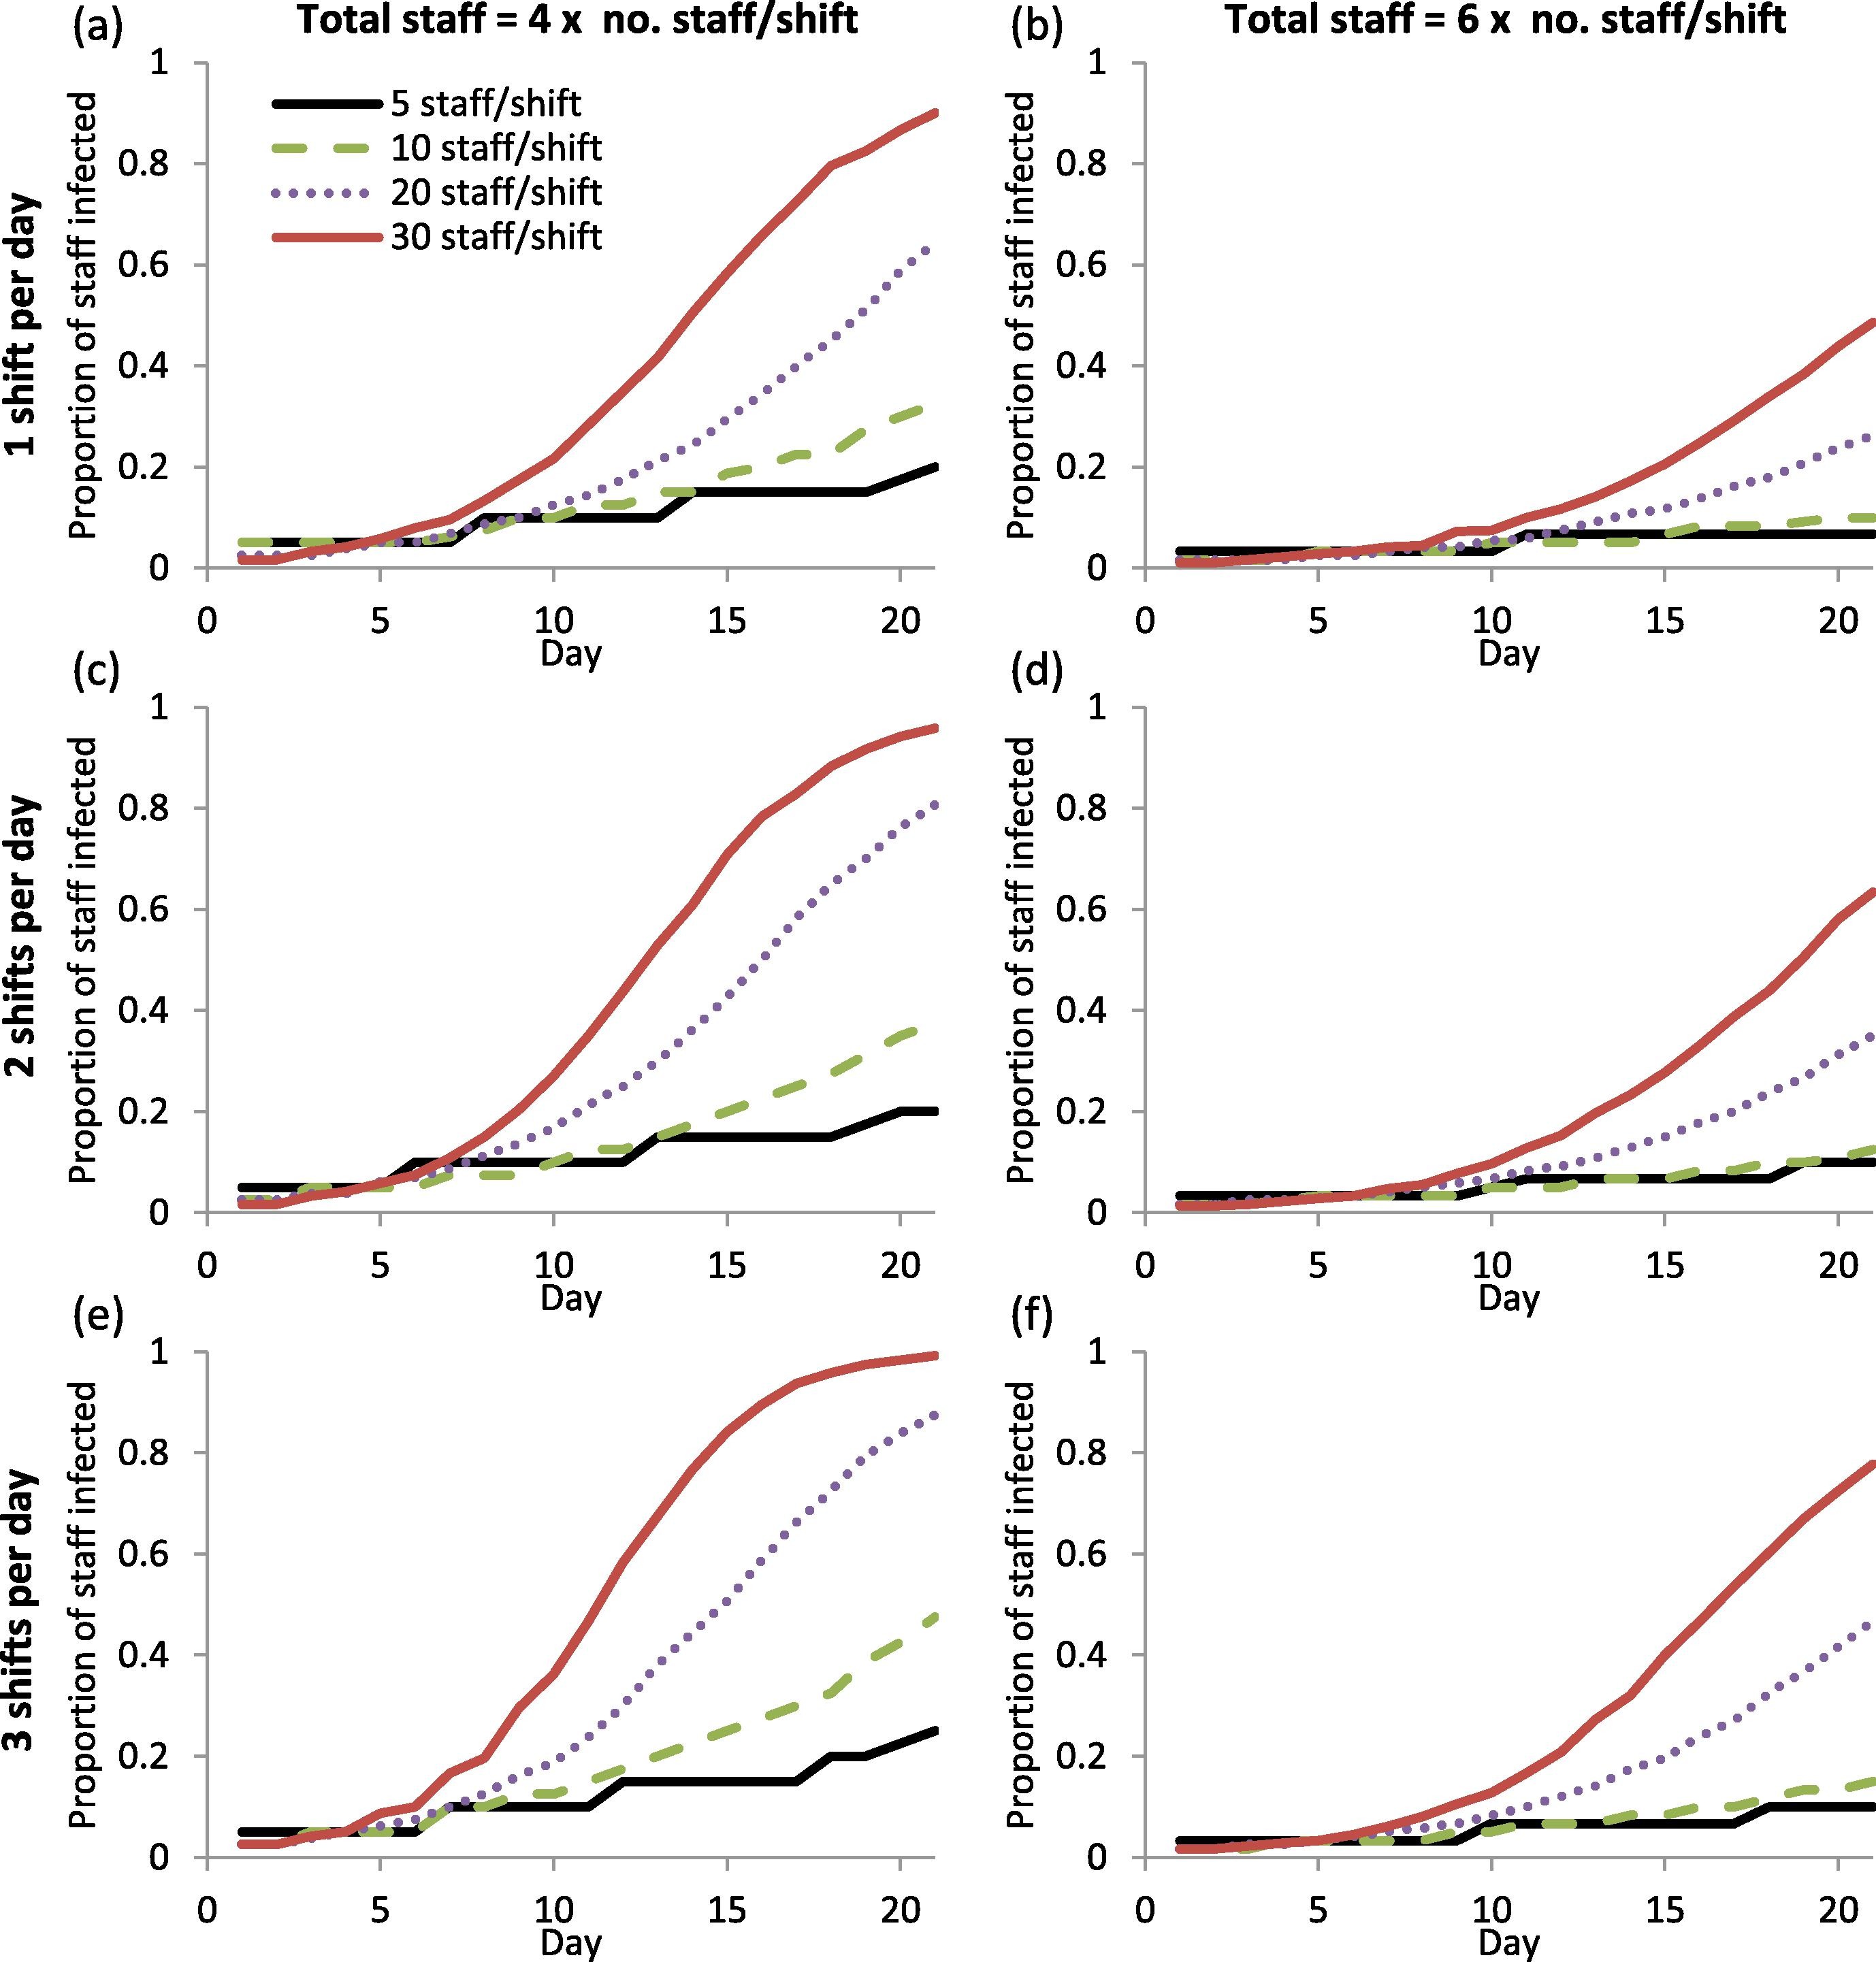
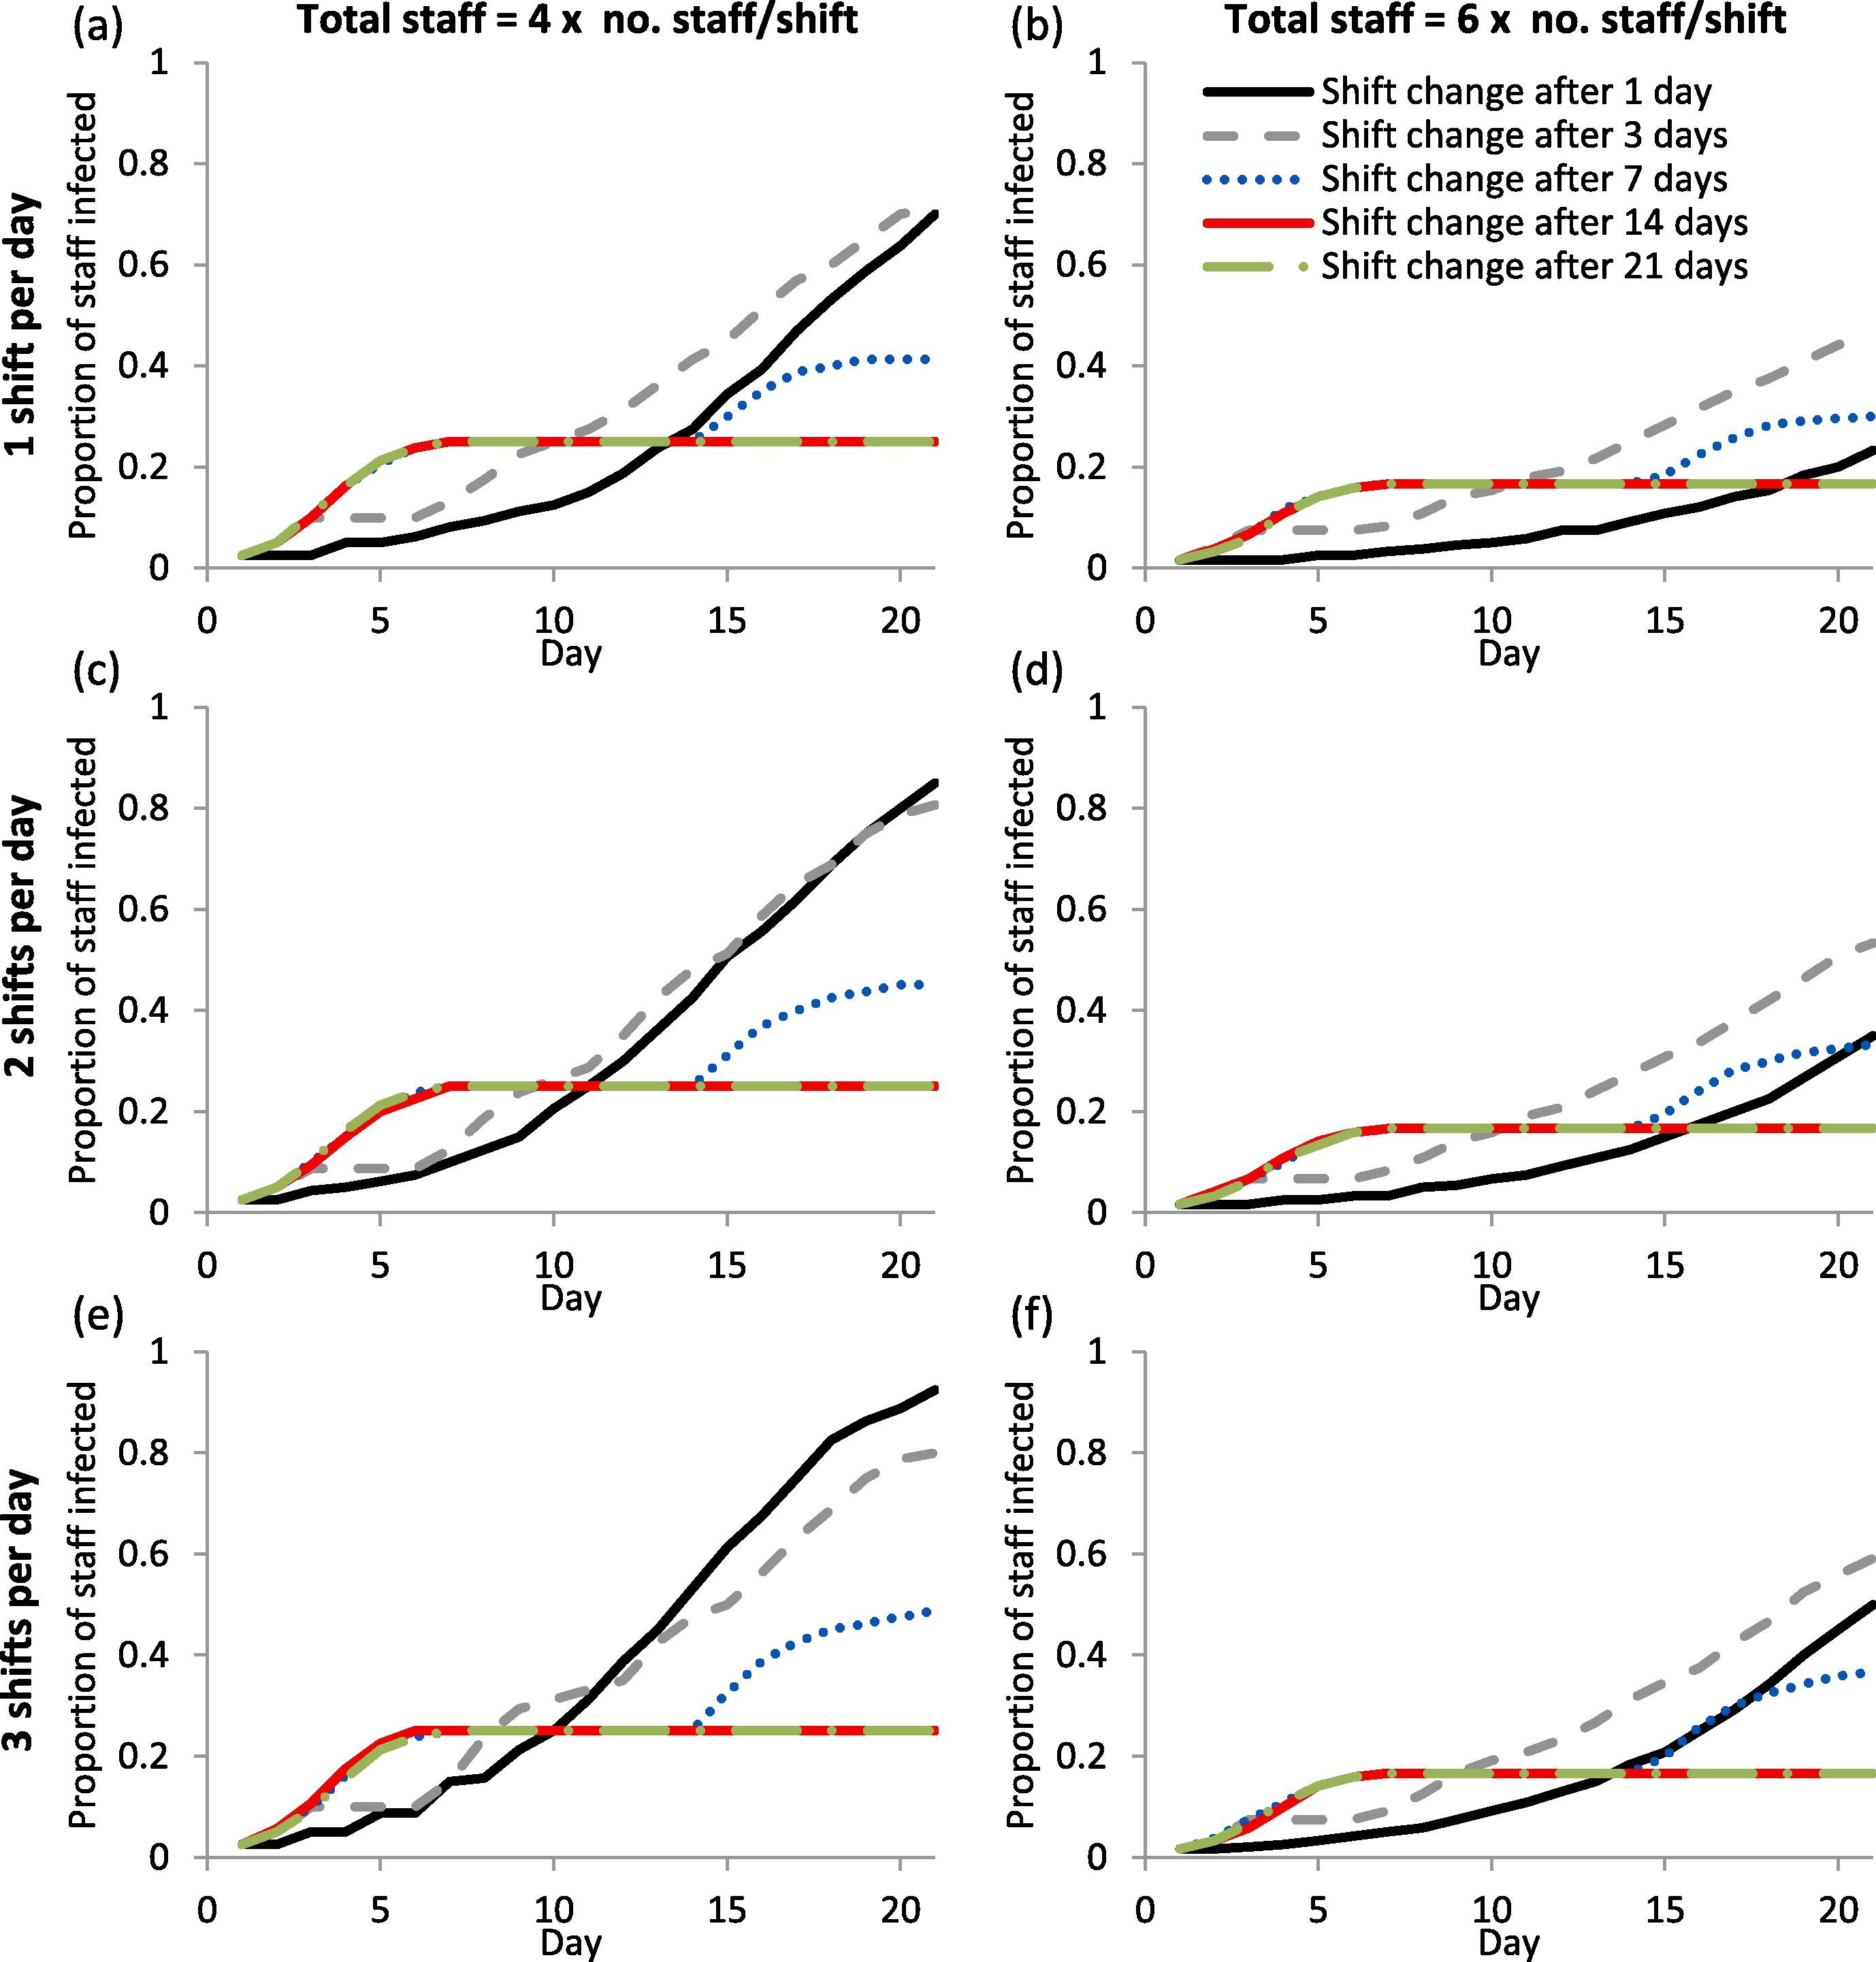
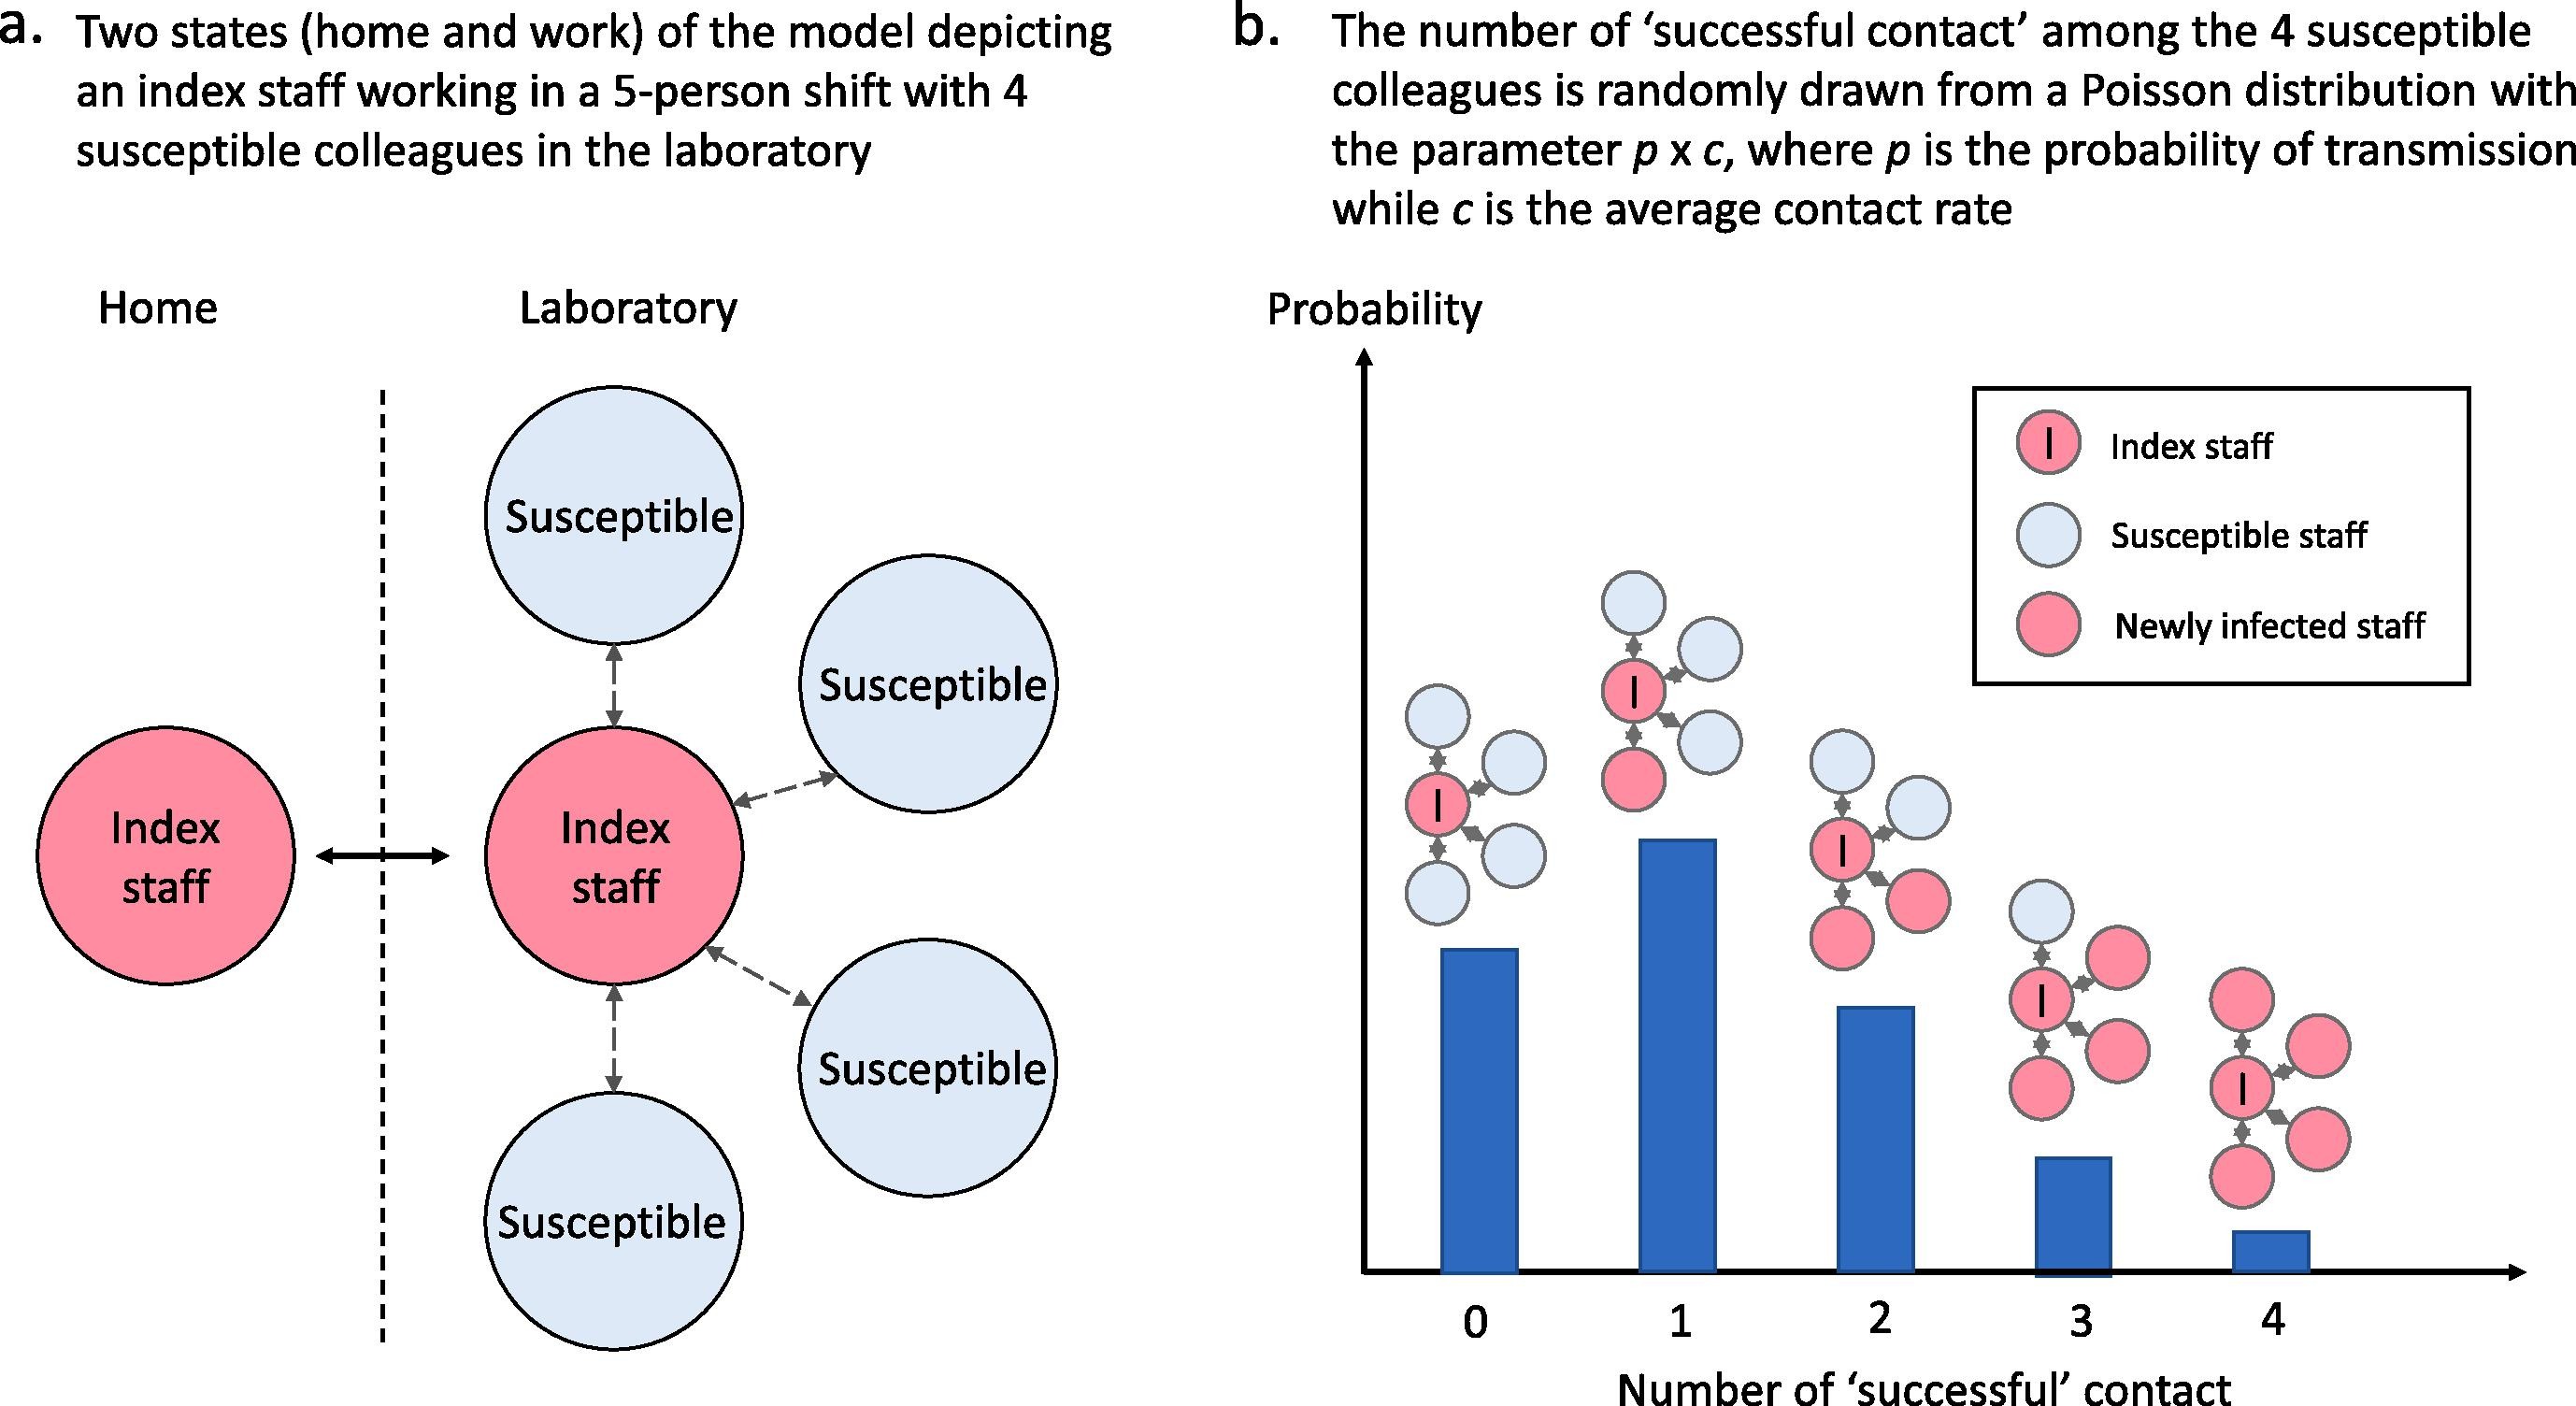
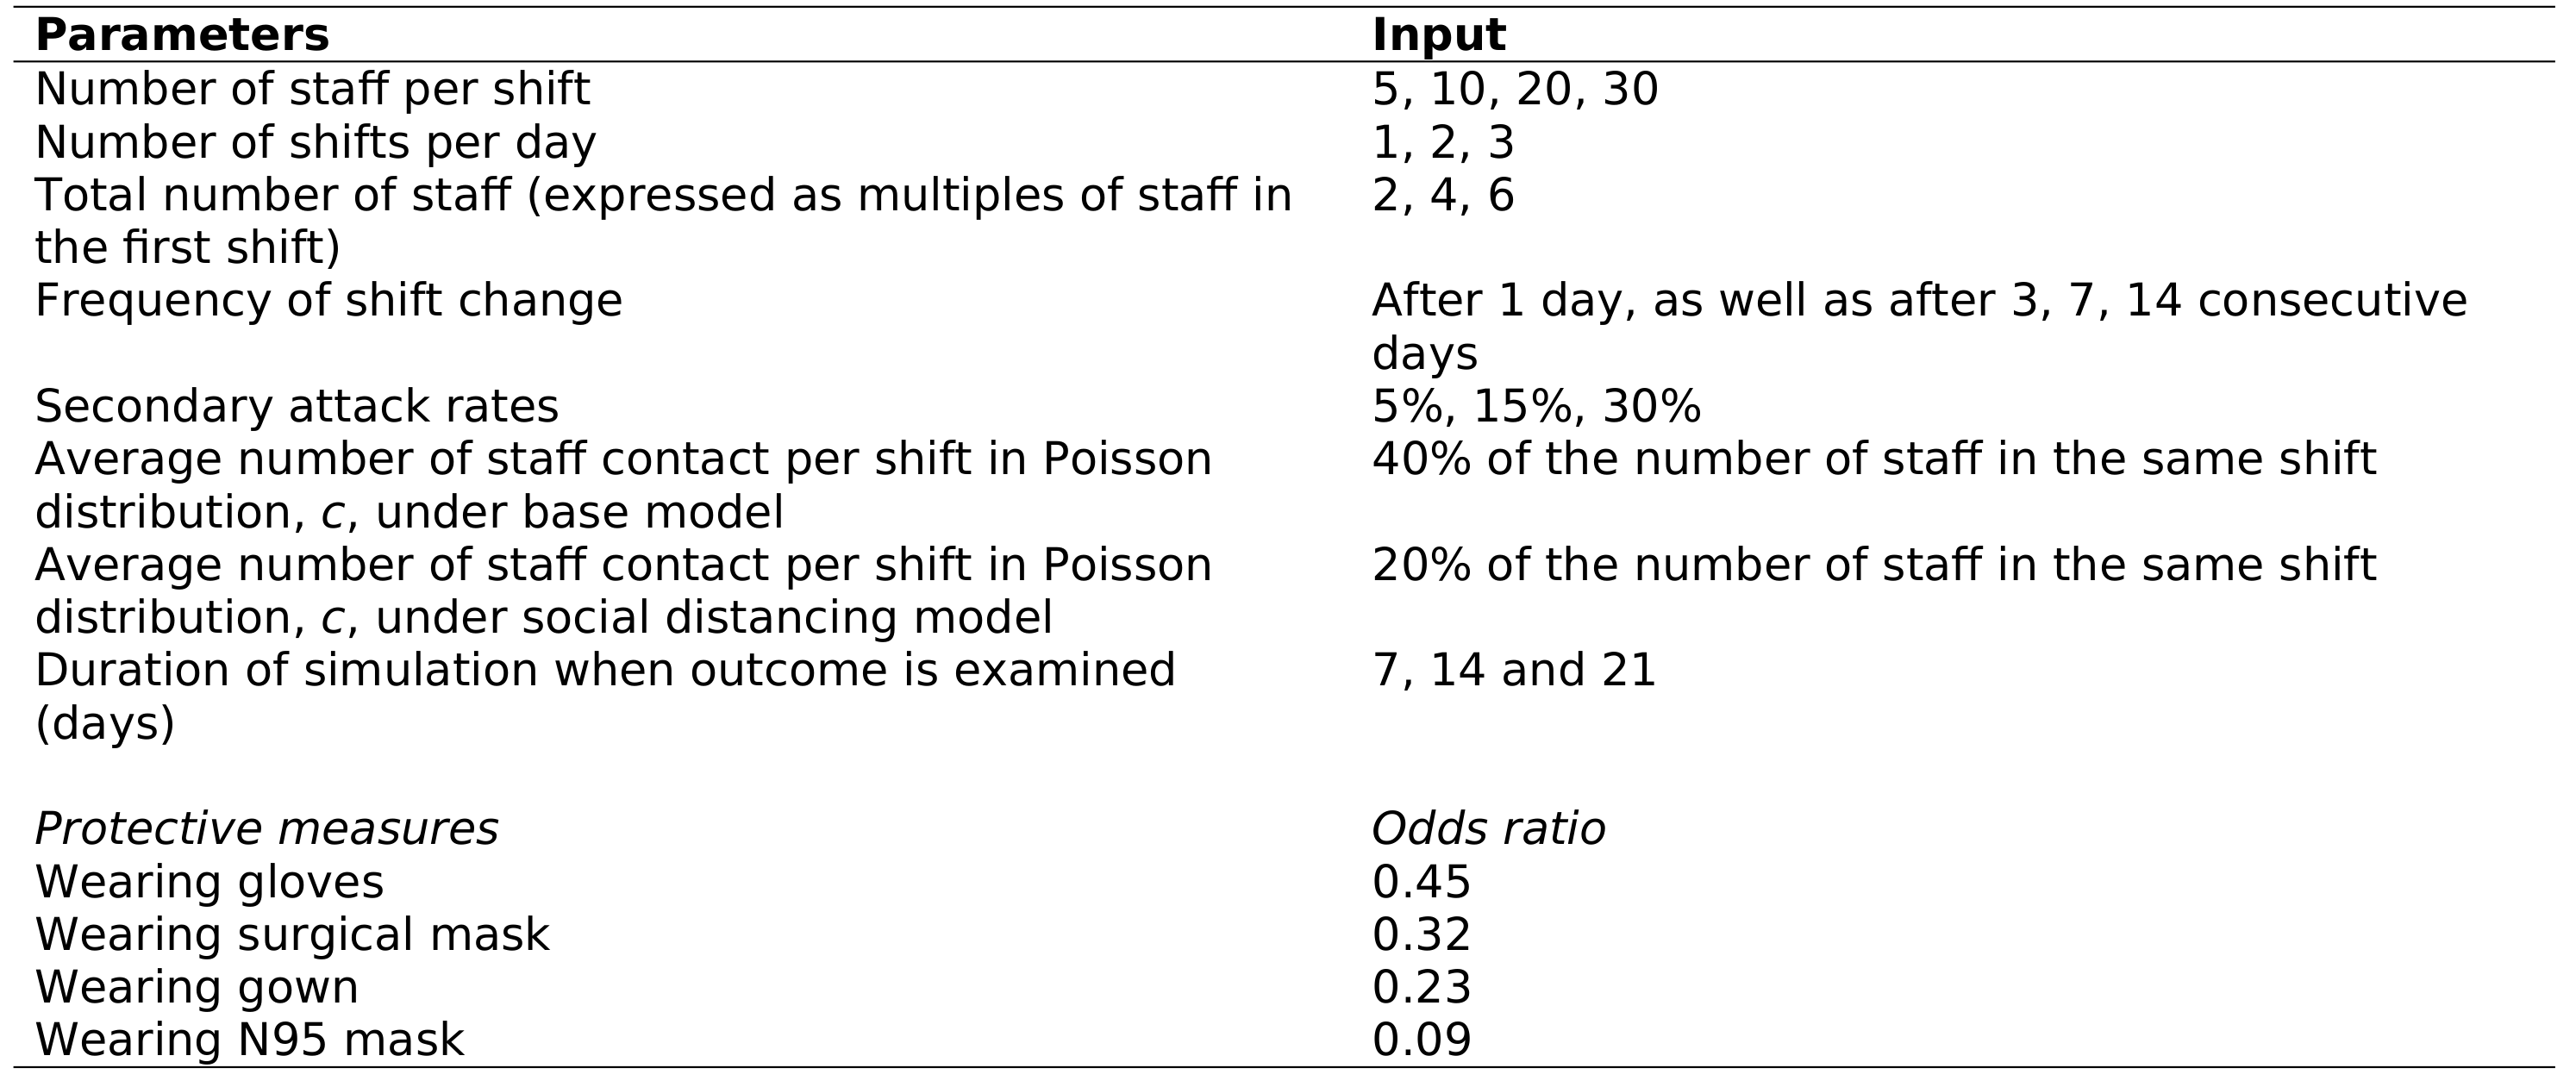
Supplemental Table 2. “Proportion of simulated laboratory staff infected by COVID-19 in base scenario with 15% probability of secondary infection at the end of day 7, day 14 and day 21 of the simulation. In this base scenario, the simulated staff worked fixed alternating workdays (i.e. fixed consecutive days on, and fixed minimum consecutive days off). The results shown are the median of 100 cycles of simulation. NA = not available as the number of staff per shift is too low to simulate under the required conditions.” Lim et al. (2020)
Reformatted table:
| 0 |
7 |
1.0 |
5.0 |
2 |
1 |
0.20 |
| 1 |
7 |
1.0 |
5.0 |
2 |
3 |
0.20 |
| 2 |
7 |
1.0 |
5.0 |
2 |
7 |
0.30 |
| 3 |
7 |
1.0 |
5.0 |
2 |
14 |
0.40 |
| 4 |
7 |
1.0 |
5.0 |
2 |
21 |
0.30 |
| ... |
... |
... |
... |
... |
... |
... |
| 535 |
21 |
3.0 |
30.0 |
6 |
1 |
0.80 |
| 536 |
21 |
3.0 |
30.0 |
6 |
3 |
0.78 |
| 537 |
21 |
3.0 |
30.0 |
6 |
7 |
0.39 |
| 538 |
21 |
3.0 |
30.0 |
6 |
14 |
0.17 |
| 539 |
21 |
3.0 |
30.0 |
6 |
21 |
0.17 |
540 rows × 6 columns
Supplemental Table 3. “Proportion of simulated laboratory staff infected by COVID-19 in base scenario with 5% probability of secondary infection at the end of day 7, day 14 and day 21 of the simulation. In this scenario, the simulated staff worked fixed alternating workdays (i.e. fixed consecutive days on, and fixed minimum consecutive days off). The results shown are the median of 100 cycles of simulation. NA = not available as the number of staff per shift was too low to simulate under the required conditions.” Lim et al. (2020)
Reformatted table:
| 0 |
7 |
1.0 |
5.0 |
2 |
1 |
0.10 |
| 1 |
7 |
1.0 |
5.0 |
2 |
3 |
0.10 |
| 2 |
7 |
1.0 |
5.0 |
2 |
7 |
0.20 |
| 3 |
7 |
1.0 |
5.0 |
2 |
14 |
0.10 |
| 4 |
7 |
1.0 |
5.0 |
2 |
21 |
0.20 |
| ... |
... |
... |
... |
... |
... |
... |
| 535 |
21 |
3.0 |
30.0 |
6 |
1 |
0.06 |
| 536 |
21 |
3.0 |
30.0 |
6 |
3 |
0.11 |
| 537 |
21 |
3.0 |
30.0 |
6 |
7 |
0.22 |
| 538 |
21 |
3.0 |
30.0 |
6 |
14 |
0.17 |
| 539 |
21 |
3.0 |
30.0 |
6 |
21 |
0.17 |
540 rows × 6 columns
Supplemental Table 4. “Proportion of simulated laboratory staff infected by COVID-19 in base scenario with 30% probability of secondary infection at the end of day 7, day 14 and day 21 of the simulation. In this scenario, the simulated staff worked fixed alternating workdays (i.e. fixed consecutive days on, and fixed minimum consecutive days off). The results shown are the median of 100 cycles of simulation. NA = not available as the number of staff per shift was too low to simulate under the required conditions.” Lim et al. (2020)
Reformatted table:
| 0 |
7 |
1.0 |
5.0 |
2 |
1 |
0.40 |
| 1 |
7 |
1.0 |
5.0 |
2 |
3 |
0.30 |
| 2 |
7 |
1.0 |
5.0 |
2 |
7 |
0.50 |
| 3 |
7 |
1.0 |
5.0 |
2 |
14 |
0.50 |
| 4 |
7 |
1.0 |
5.0 |
2 |
21 |
0.50 |
| ... |
... |
... |
... |
... |
... |
... |
| 535 |
21 |
3.0 |
30.0 |
6 |
1 |
0.99 |
| 536 |
21 |
3.0 |
30.0 |
6 |
3 |
0.91 |
| 537 |
21 |
3.0 |
30.0 |
6 |
7 |
0.39 |
| 538 |
21 |
3.0 |
30.0 |
6 |
14 |
0.17 |
| 539 |
21 |
3.0 |
30.0 |
6 |
21 |
0.17 |
540 rows × 6 columns
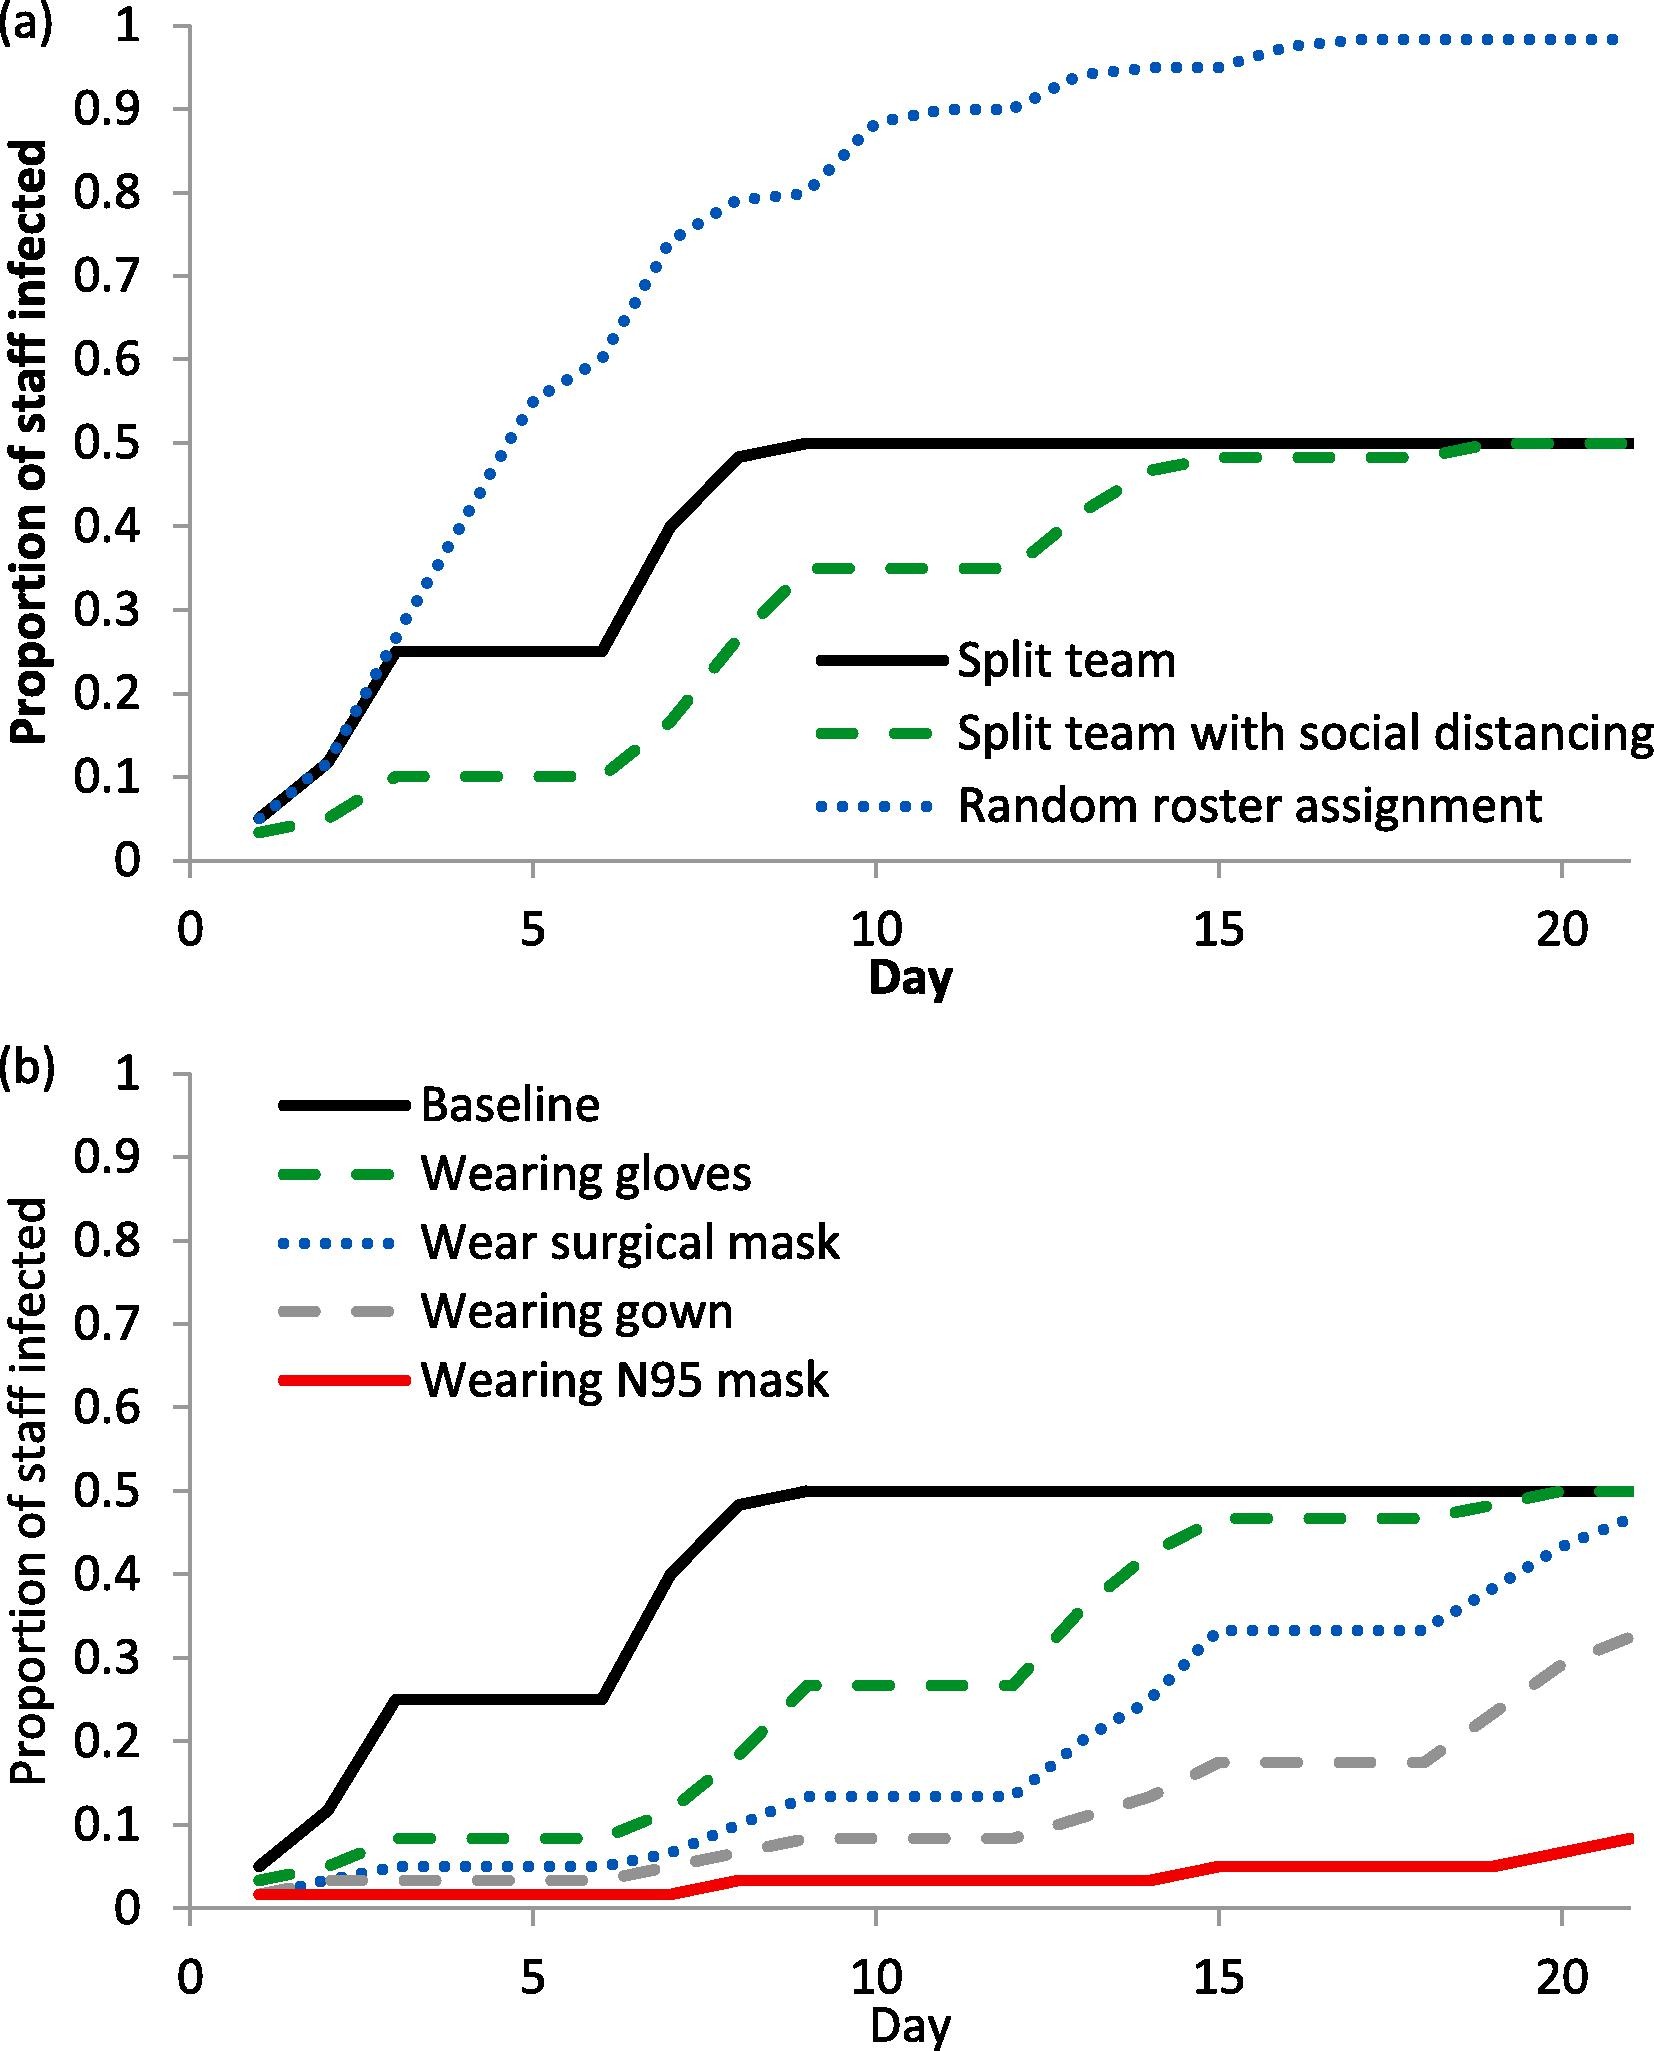
Supplemental Table 5. “Proportion of simulated laboratory staff working in a single shift infected by COVID-19 in a scenario with 15% probability of secondary infection at the end of day 7, day 14 and day 21 of the simulation without predefined minimum rest day (i.e. random shift assignment after each shift). The results shown are the median of 100 cycles of simulation.” Lim et al. (2020)
Reformatted table:
| 0 |
7 |
1.0 |
5.0 |
2 |
1 |
0.25 |
| 1 |
7 |
1.0 |
5.0 |
2 |
3 |
0.30 |
| 2 |
7 |
1.0 |
5.0 |
2 |
7 |
0.30 |
| 3 |
7 |
1.0 |
5.0 |
2 |
14 |
0.30 |
| 4 |
7 |
1.0 |
5.0 |
2 |
21 |
0.40 |
| ... |
... |
... |
... |
... |
... |
... |
| 175 |
21 |
1.0 |
30.0 |
6 |
1 |
0.59 |
| 176 |
21 |
1.0 |
30.0 |
6 |
3 |
0.67 |
| 177 |
21 |
1.0 |
30.0 |
6 |
7 |
0.42 |
| 178 |
21 |
1.0 |
30.0 |
6 |
14 |
0.31 |
| 179 |
21 |
1.0 |
30.0 |
6 |
21 |
0.17 |
180 rows × 6 columns
Supplemental Table 6. “Proportion of simulated laboratory staff infected by COVID-19 in base scenario with 15% probability of secondary infection at the end of day 14 of the simulation with the staff observing workplace social distancing (by reducing the contact rate by half) and using various personal protective equipment. In this scenario, the simulated staff worked fixed alternating workdays (i.e. fixed consecutive days on, and fixed minimum consecutive days off). The results shown are the median of 100 cycles of simulation. NA = not available as the number of staff per shift is too low to simulate under the required conditions.” Lim et al. (2020)
Reformatted table:
| 0 |
Gloves |
1.0 |
5.0 |
2 |
1 |
0.20 |
| 1 |
Gloves |
1.0 |
5.0 |
2 |
3 |
0.20 |
| 2 |
Gloves |
1.0 |
5.0 |
2 |
7 |
0.20 |
| 3 |
Gloves |
1.0 |
5.0 |
2 |
14 |
0.30 |
| 4 |
Gloves |
1.0 |
5.0 |
2 |
21 |
0.30 |
| ... |
... |
... |
... |
... |
... |
... |
| 895 |
Surgical mask |
3.0 |
30.0 |
6 |
1 |
0.02 |
| 896 |
Surgical mask |
3.0 |
30.0 |
6 |
3 |
0.05 |
| 897 |
Surgical mask |
3.0 |
30.0 |
6 |
7 |
0.08 |
| 898 |
Surgical mask |
3.0 |
30.0 |
6 |
14 |
0.16 |
| 899 |
Surgical mask |
3.0 |
30.0 |
6 |
21 |
0.16 |
900 rows × 6 columns
References
Lim, Chun Yee, Mary Kathryn Bohn, Giuseppe Lippi, Maurizio Ferrari, Tze Ping Loh, Kwok-Yung Yuen, Khosrow Adeli, and Andrea Rita Horvath. 2020.
“Staff Rostering, Split Team Arrangement, Social Distancing (Physical Distancing) and Use of Personal Protective Equipment to Minimize Risk of Workplace Transmission During the COVID-19 Pandemic: A Simulation Study.” Clinical Biochemistry 86 (December): 15–22.
https://doi.org/10.1016/j.clinbiochem.2020.09.003.