| Length of simulation: 1 hour |
✅ self.maxTime = 60 |
4.3 Processing |
PODSimulation() __init__ in PodSimulation.py |
| At screening station, 1% go to med eval and 99% to dispensing. At med eval station, 99% got to dispensing and 1% exit POD |
❔ Can’t find |
4.1.1 Splits |
- |
| Number of forms per designee: 1 31.8%, 2 26.7%, 3 16.8%, 4 12.6%, 5 6.8%, 6 5.6% |
❔ throughput x 3.2 - so appears to be averaged to 3.2? |
Table 1 |
plotting_ staff_ results.r |
| Service time line manager: triangular, minimum = 0.029, maximum = 0.039, mode = 0.044 |
❌ time = random. triangular( low=5/60.0, high=92/60.0, mode=23/60.0). Low 5/60 = 0.0833. High 92/60 = 1.533. Mode 23/60 = 0.3833. There is one commented out which has… Low 1.77/60 = 0.0295. Higher 2.66/60 = 0.044. Mode 2.38/60 = 0.0397. This would match the article, except maximum and mode the other way round. |
Table 2 |
visit_greeter() in Customer.py |
| Service time screening: weibull, shape = 2.29, scale = 0.142 |
✅ time = random. weibullvariate( alpha=0.142, beta=2.29 ) |
Table 2 |
visit_screener() in Customer.py |
| Service time dispensing: weibull, shape = 1, scale = 0.311 |
✅ time = random. weibullvariate( alpha=0.311, beta=1 ) |
Table 2 |
visit_dispenser() in Customer.py |
| Service time medical evaluation: lognormal, logarithmic mean = 1.024, logarithmic stdev = 0.788 |
✅ time = random. lognormvariate( mu=1.024, sigma=0.788 ) |
Table 2 |
visit_medic() in Customer.py |
| Arrival rate 100 designess per minute per POD (following a Poisson distribution) |
❌ self.meanTBA = 1/200.0 #1/float(115) #mean time between arrivals, minutes btw entities. This would mean 200 arrivals per minute, rather than 100. |
4.1.4 Arrival rate |
PODSimulation() __init__ in PodSimulation.py |
| Three simulation runs |
🟡 This wasn’t the case when I first started, but have already been changing this |
4.3 Processing |
main.py |
| Number of staff members per station - mentions examples of where “each station could have up to thirty staff members” or “for example 60”. We know it cannot be 30, but could reasonably assume to be 60 |
🟡 This wasn’t the case when I first started, but I have already noticed and addressed, and fixed to 60. |
3 Problem and 4.3 Processing |
Staff Allocation Problem() in Staff Allocation Problem.py |
| Default crossover rate 1.0 and n=1 |
✅ ea.variator = [variators. n_point_crossover] with variators imported from inspyred.ec, which can see from docs the default crossover rate is 1 and default number of crossover points is 1 |
5 Experimental results |
nsga2.py |
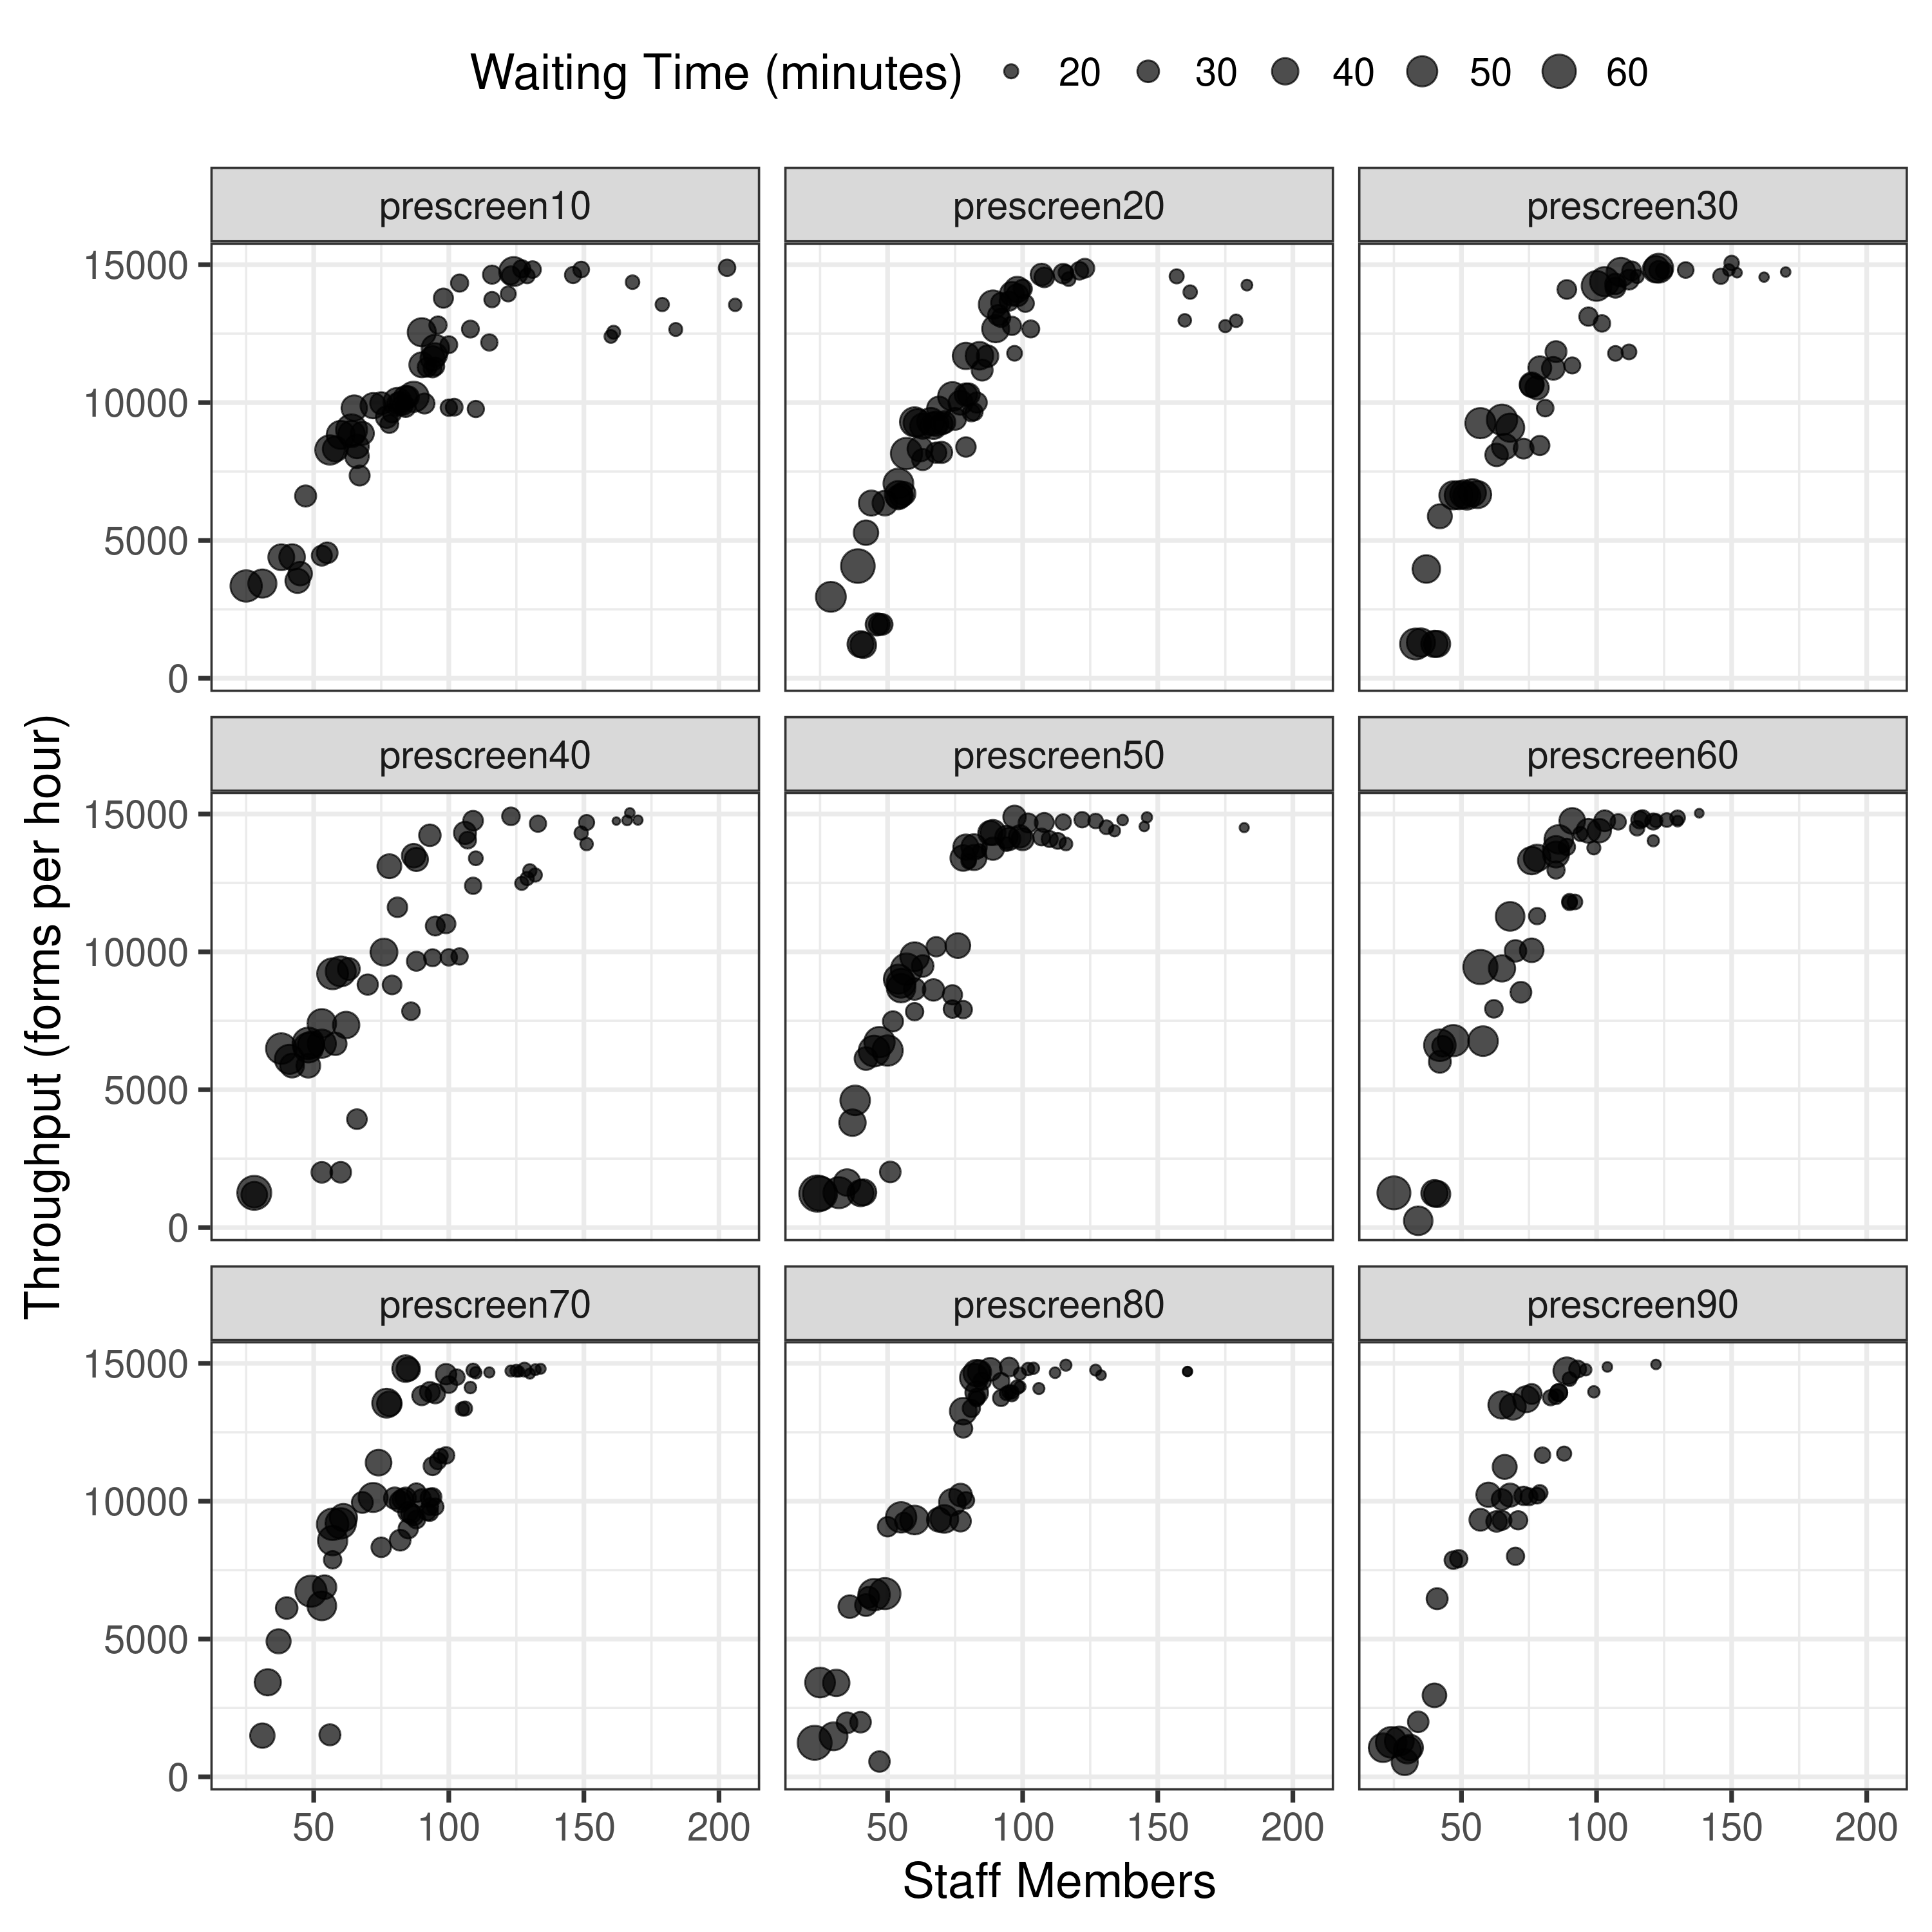
| Experiment 1: tri-objective model, population 100, generations 50, pre-screened scenarios 10%, 20%, 30%… 90% |
✅ As in the input files like 10-prescreened.txt |
4.1.1 Splits and Figure 5 |
As left |
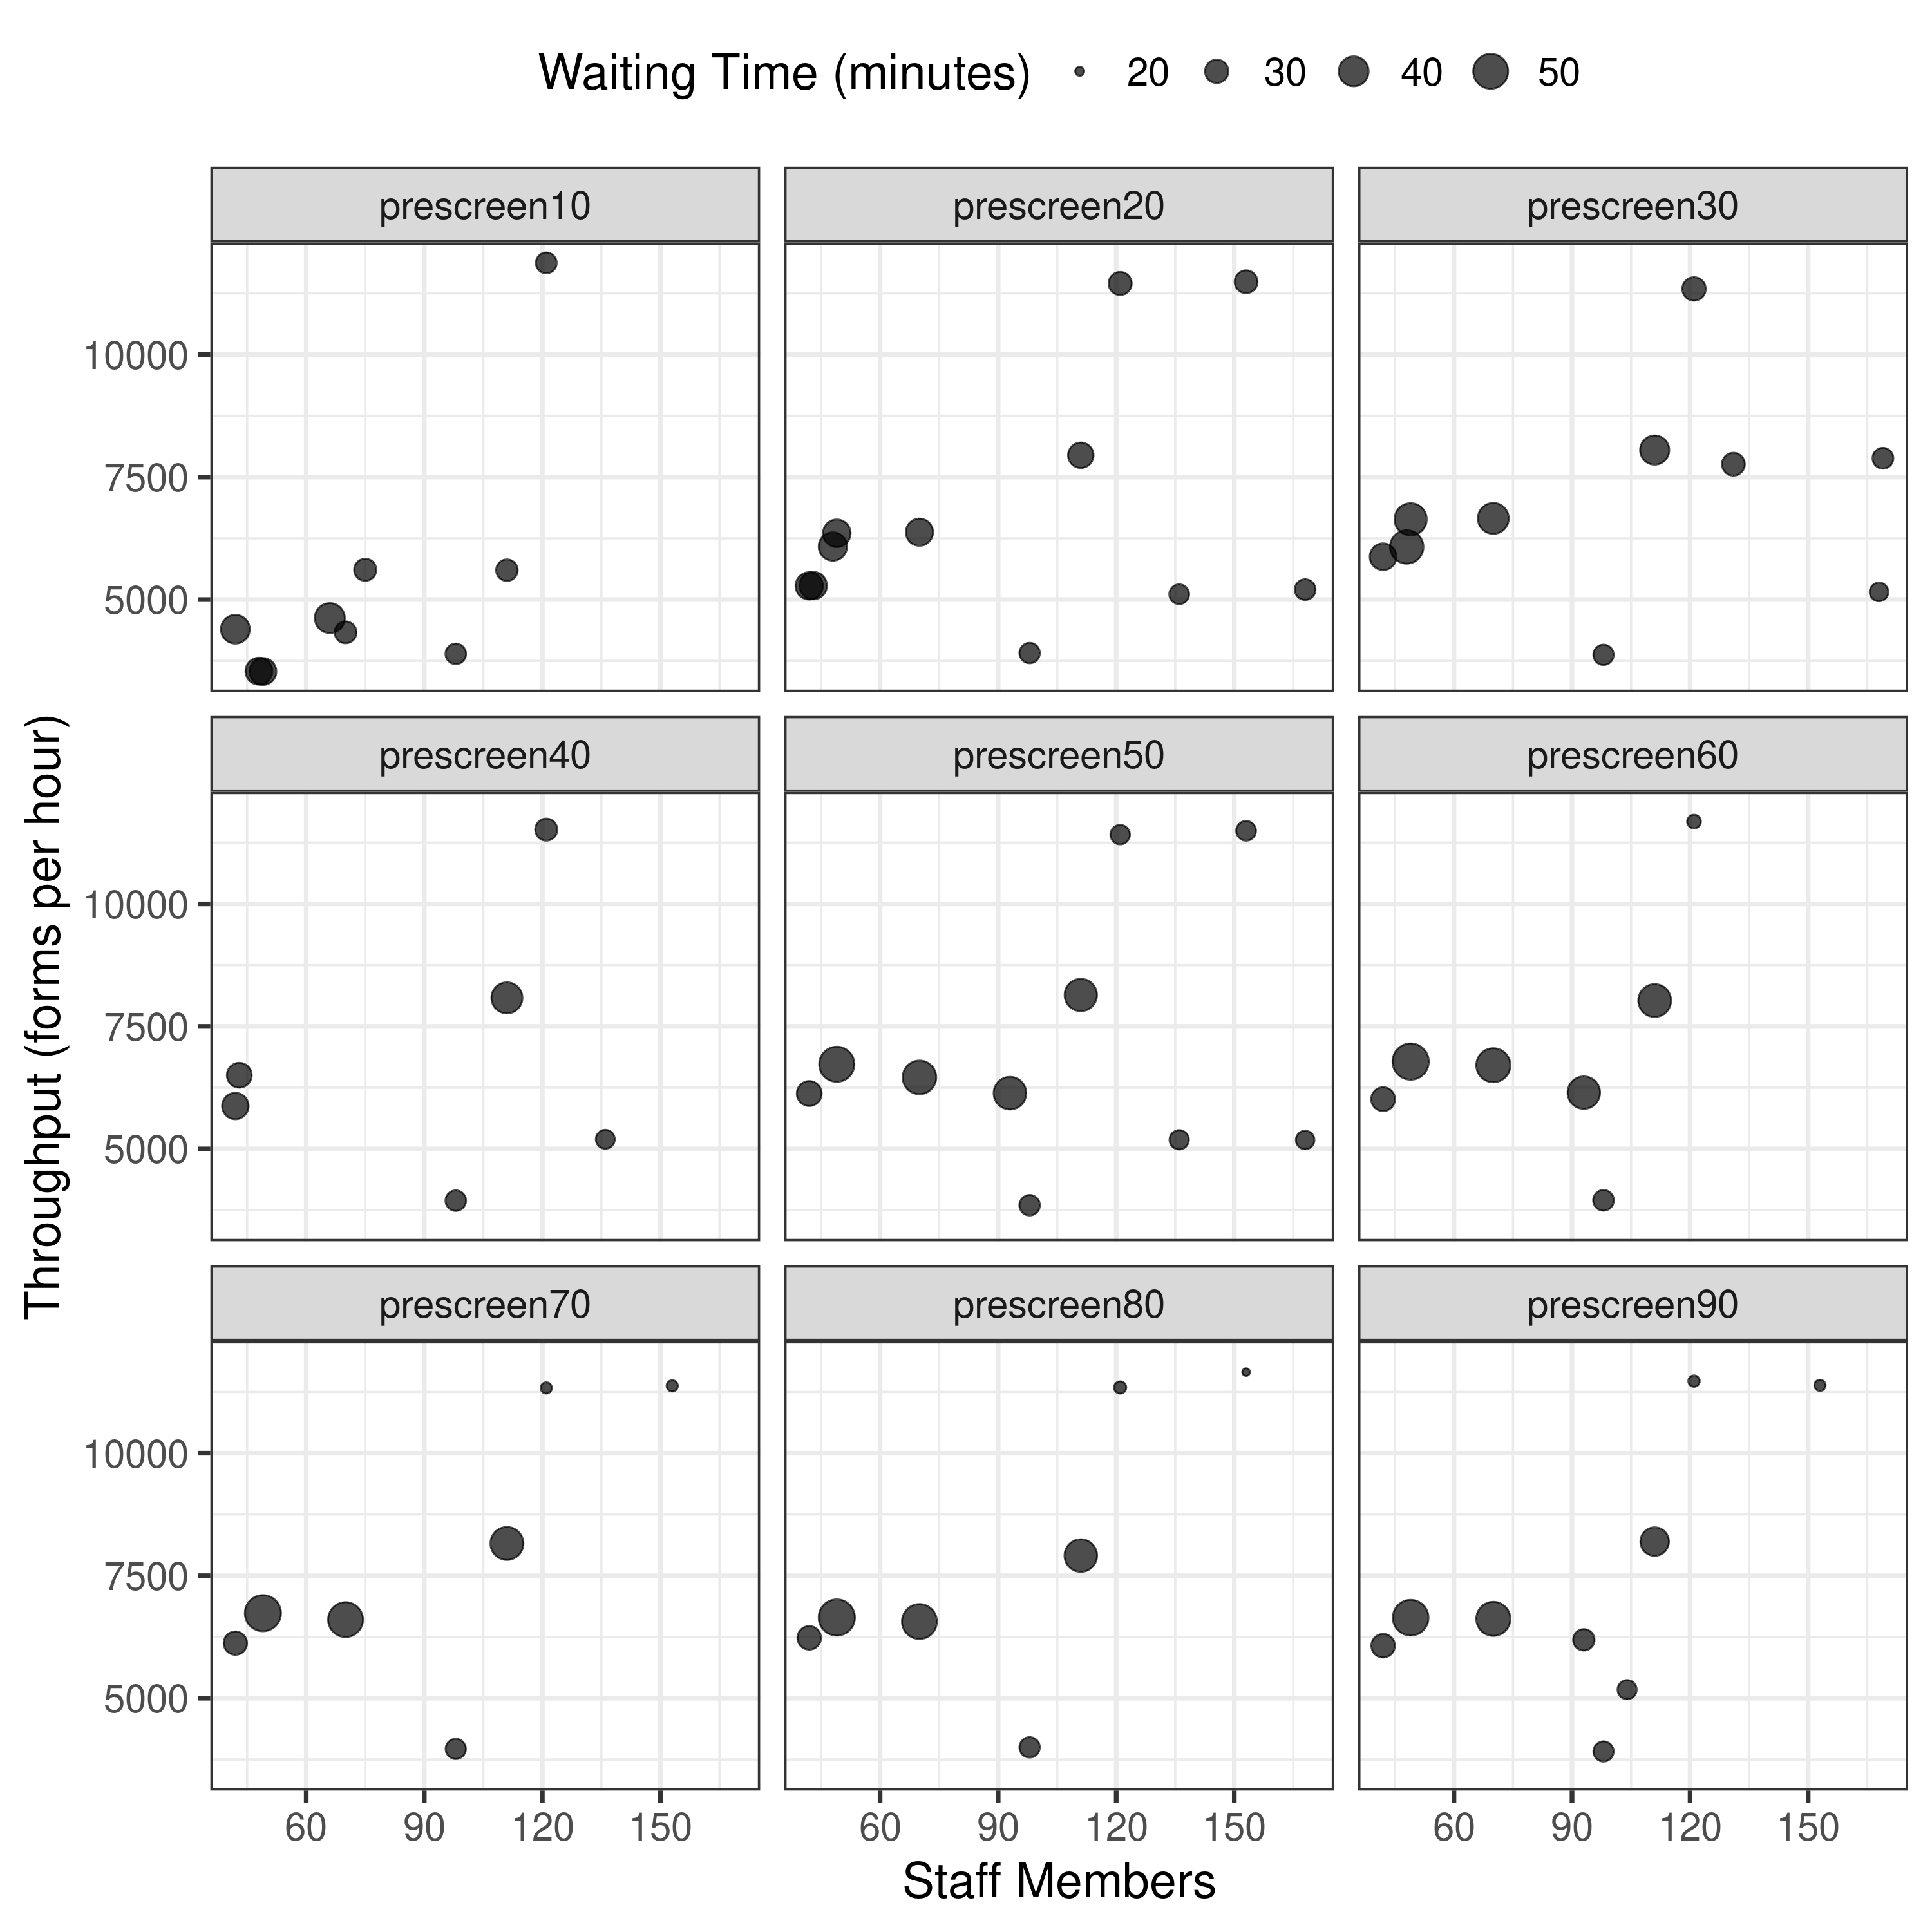
| Experiment 2: bi-objective model, population 50, generations 25, pre-screened scenarios 10%, 20%, 30%… 90% |
TBC |
4.1.1 Splits and Figure 7 |
- |
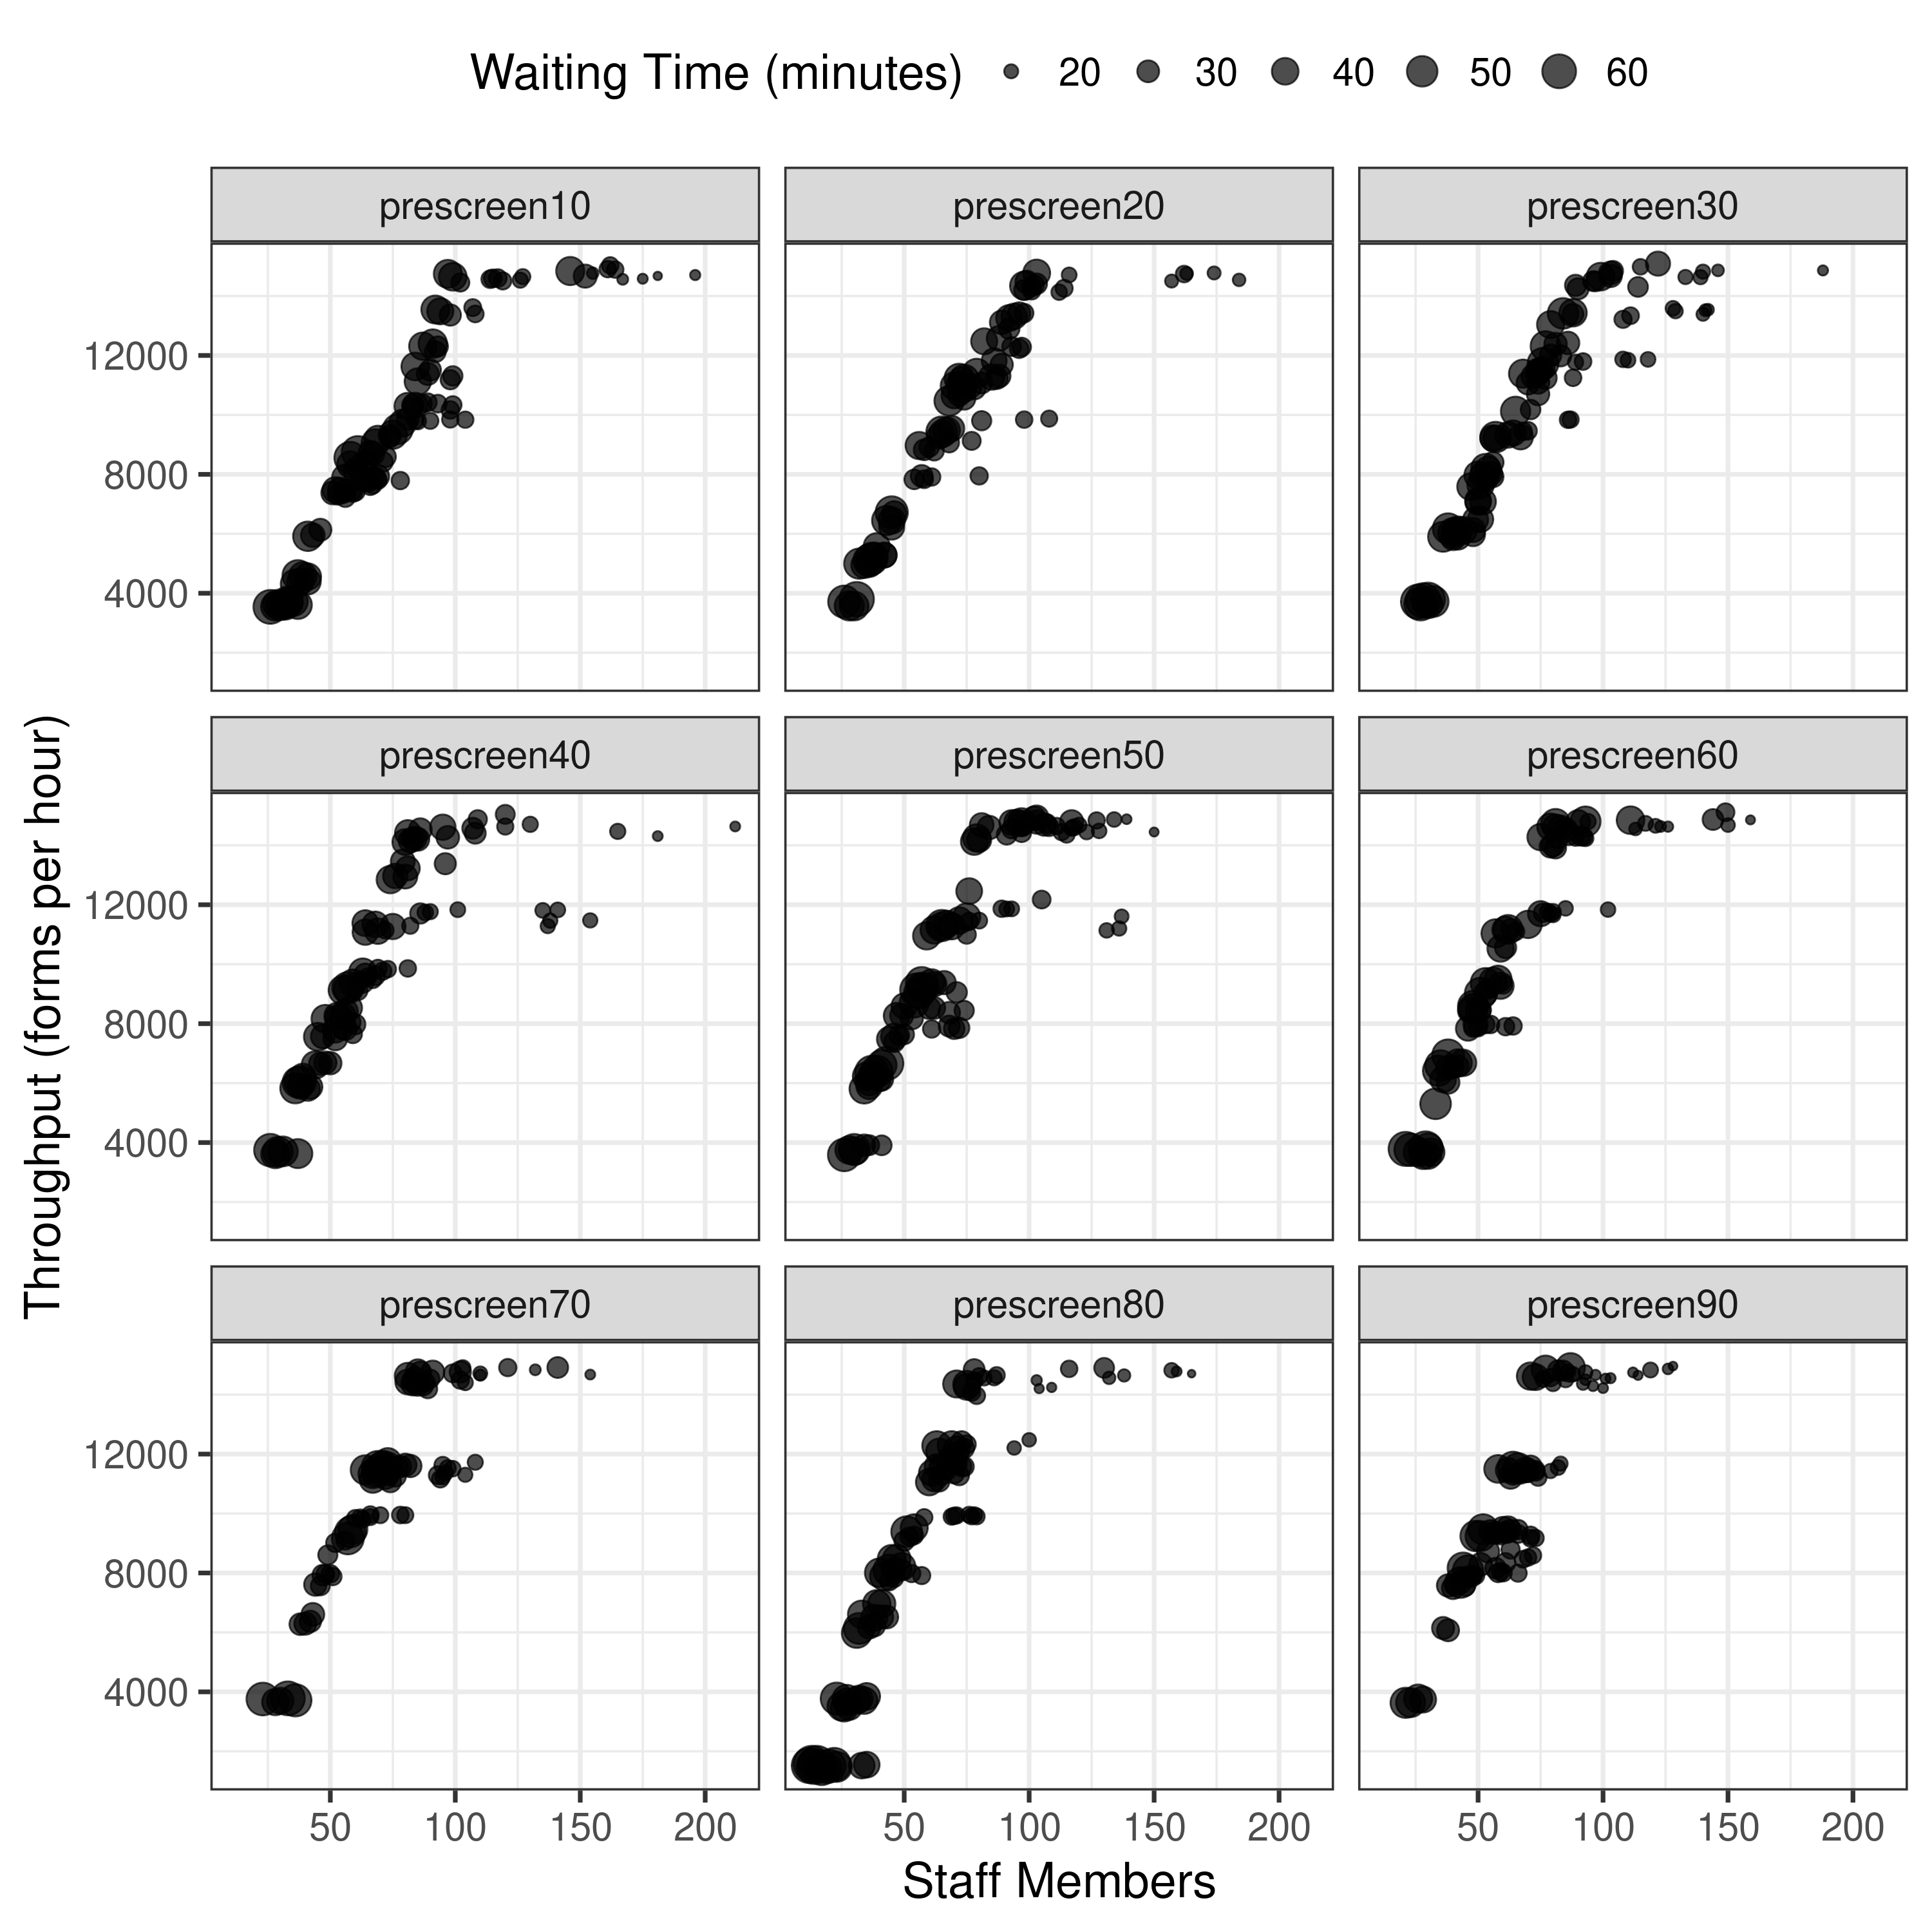
| Experiment 3: tri-objective model, pre-screened percentage ??, (a) 100 pop 50 gen (b) 200 pop 100 gen (c) 50 pop 25 gen |
TBC
Note: Where I am unsure of pre-screened percentage here, I presume it might be default from code which, if parameterReader == None, then self. preScreened Percentage = 0.1 |
5.3 Experiment 3 and Figure 8 |
-
PODSimulation() __init__ in PodSimulation.py |
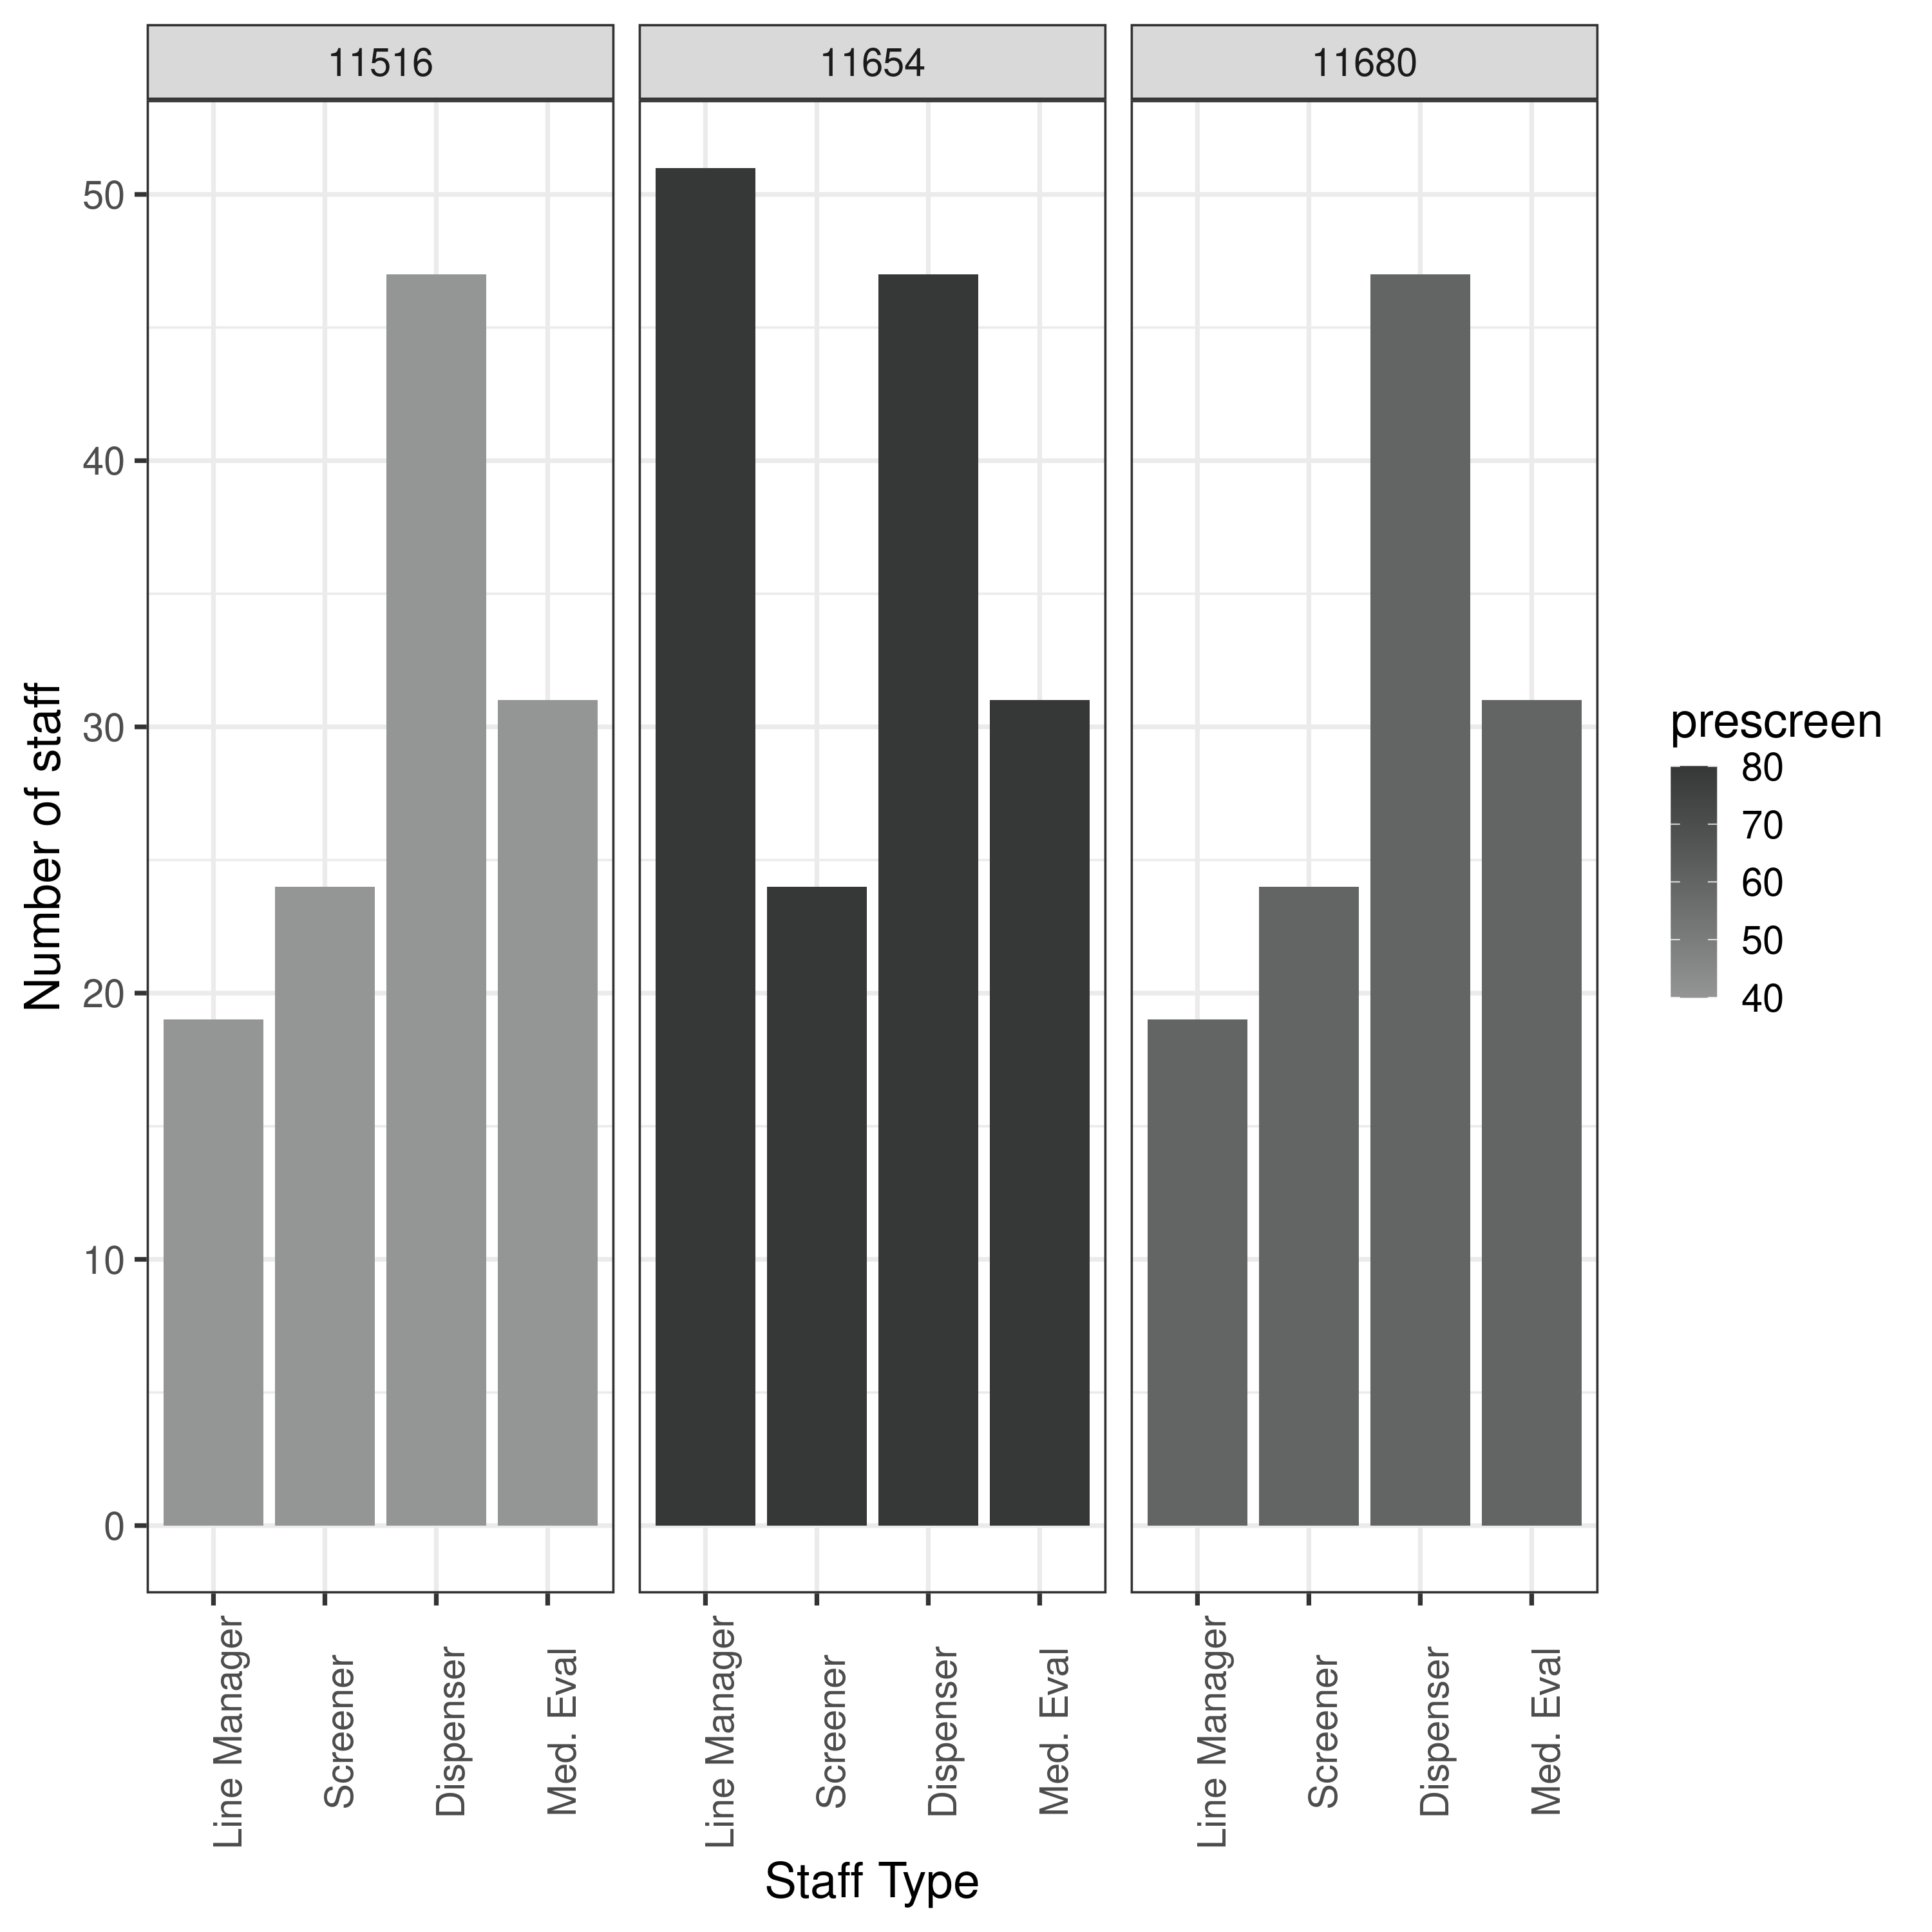
| Experiment 4: tri-objective model, maximum line managers 1, 2 or 3 |
TBC |
5.4 Experiment 4 and Figure 9 |
- |
| Experiment 5: 6 dispensing, 6 screening, 4 line manager, one medical evaluator, number of replications 1-7 |
TBC |
5.5 Experiment 5 and Figure 10 |
- |