| Estimate | Avg | LowerBound | UpperBound | |
|---|---|---|---|---|
| 0 | Wait time | 66.66 | 63.75 | 69.57 |
| 1 | No. in (Designees) | 11979.15 | 11935.90 | 12022.40 |
| 2 | No. out (Designees) | 473.20 | 458.87 | 487.53 |
| 3 | Dispensing wait time | 18.84 | 18.33 | 19.35 |
| 4 | Line mngr. wait time | 23.73 | 23.60 | 23.86 |
| 5 | Med. eval. wait time | 9.06 | 6.05 | 12.06 |
| 6 | Screening wait time | 15.04 | 14.79 | 15.29 |
| 7 | Dispensing no. waiting | 434.81 | 423.35 | 446.27 |
| 8 | Line mngr. no. waiting | 4733.55 | 4705.73 | 4761.38 |
| 9 | Med. eval. no. waiting | 2.19 | 1.42 | 2.96 |
| 10 | Screening no. waiting | 569.06 | 560.52 | 577.61 |
Summary report
For computational reproducibility assessment of Hernandez et al. 2015
Study
Hernandez, I., Ramirez-Marquez, J., Starr, D., McKay, R., Guthartz, S., Motherwell, M., Barcellona, J. Optimal staffing strategies for points of dispensing. Computers & Industrial Engineering 83 (2015). https://doi.org/10.1016/j.cie.2015.02.015.
This study models Points-of-Dispensing (PODs) in New York City. These are sites set up during a public health emergency to dispense countermeasures. The authors use evolutionary algorithms combined with discrete-event simulation to explore optimal staff numbers with regards to resource use, wait time and throughput.
Computational reproducibility
Successfully reproduced 1 out of 8 (12.5%) of items from the scope in 17h 56m (44.8%).
Required troubleshooting:
- Environment - installing packages and working with unsupported Python version
- Additional repositories - realised that another repository from the author is required and importing
- Organisation - organising files and amending output folder names
- Run time - exploring parameters that can run with similar results but shorter run time, and adding parallel processing
- Parameters - identifying mis-match parameters between article and code and attempting to correct
- Scenarios - identifying how to implement scenarios and writing code, or spotting code that can be used for scenario from part of a script
- Figures and tables - using provided code as a starting place, wrote additional code to tweak plotting code, and pre-process data beforehand
- Command line - removing import of
simpy.simplotwhich prevented from running on the command line
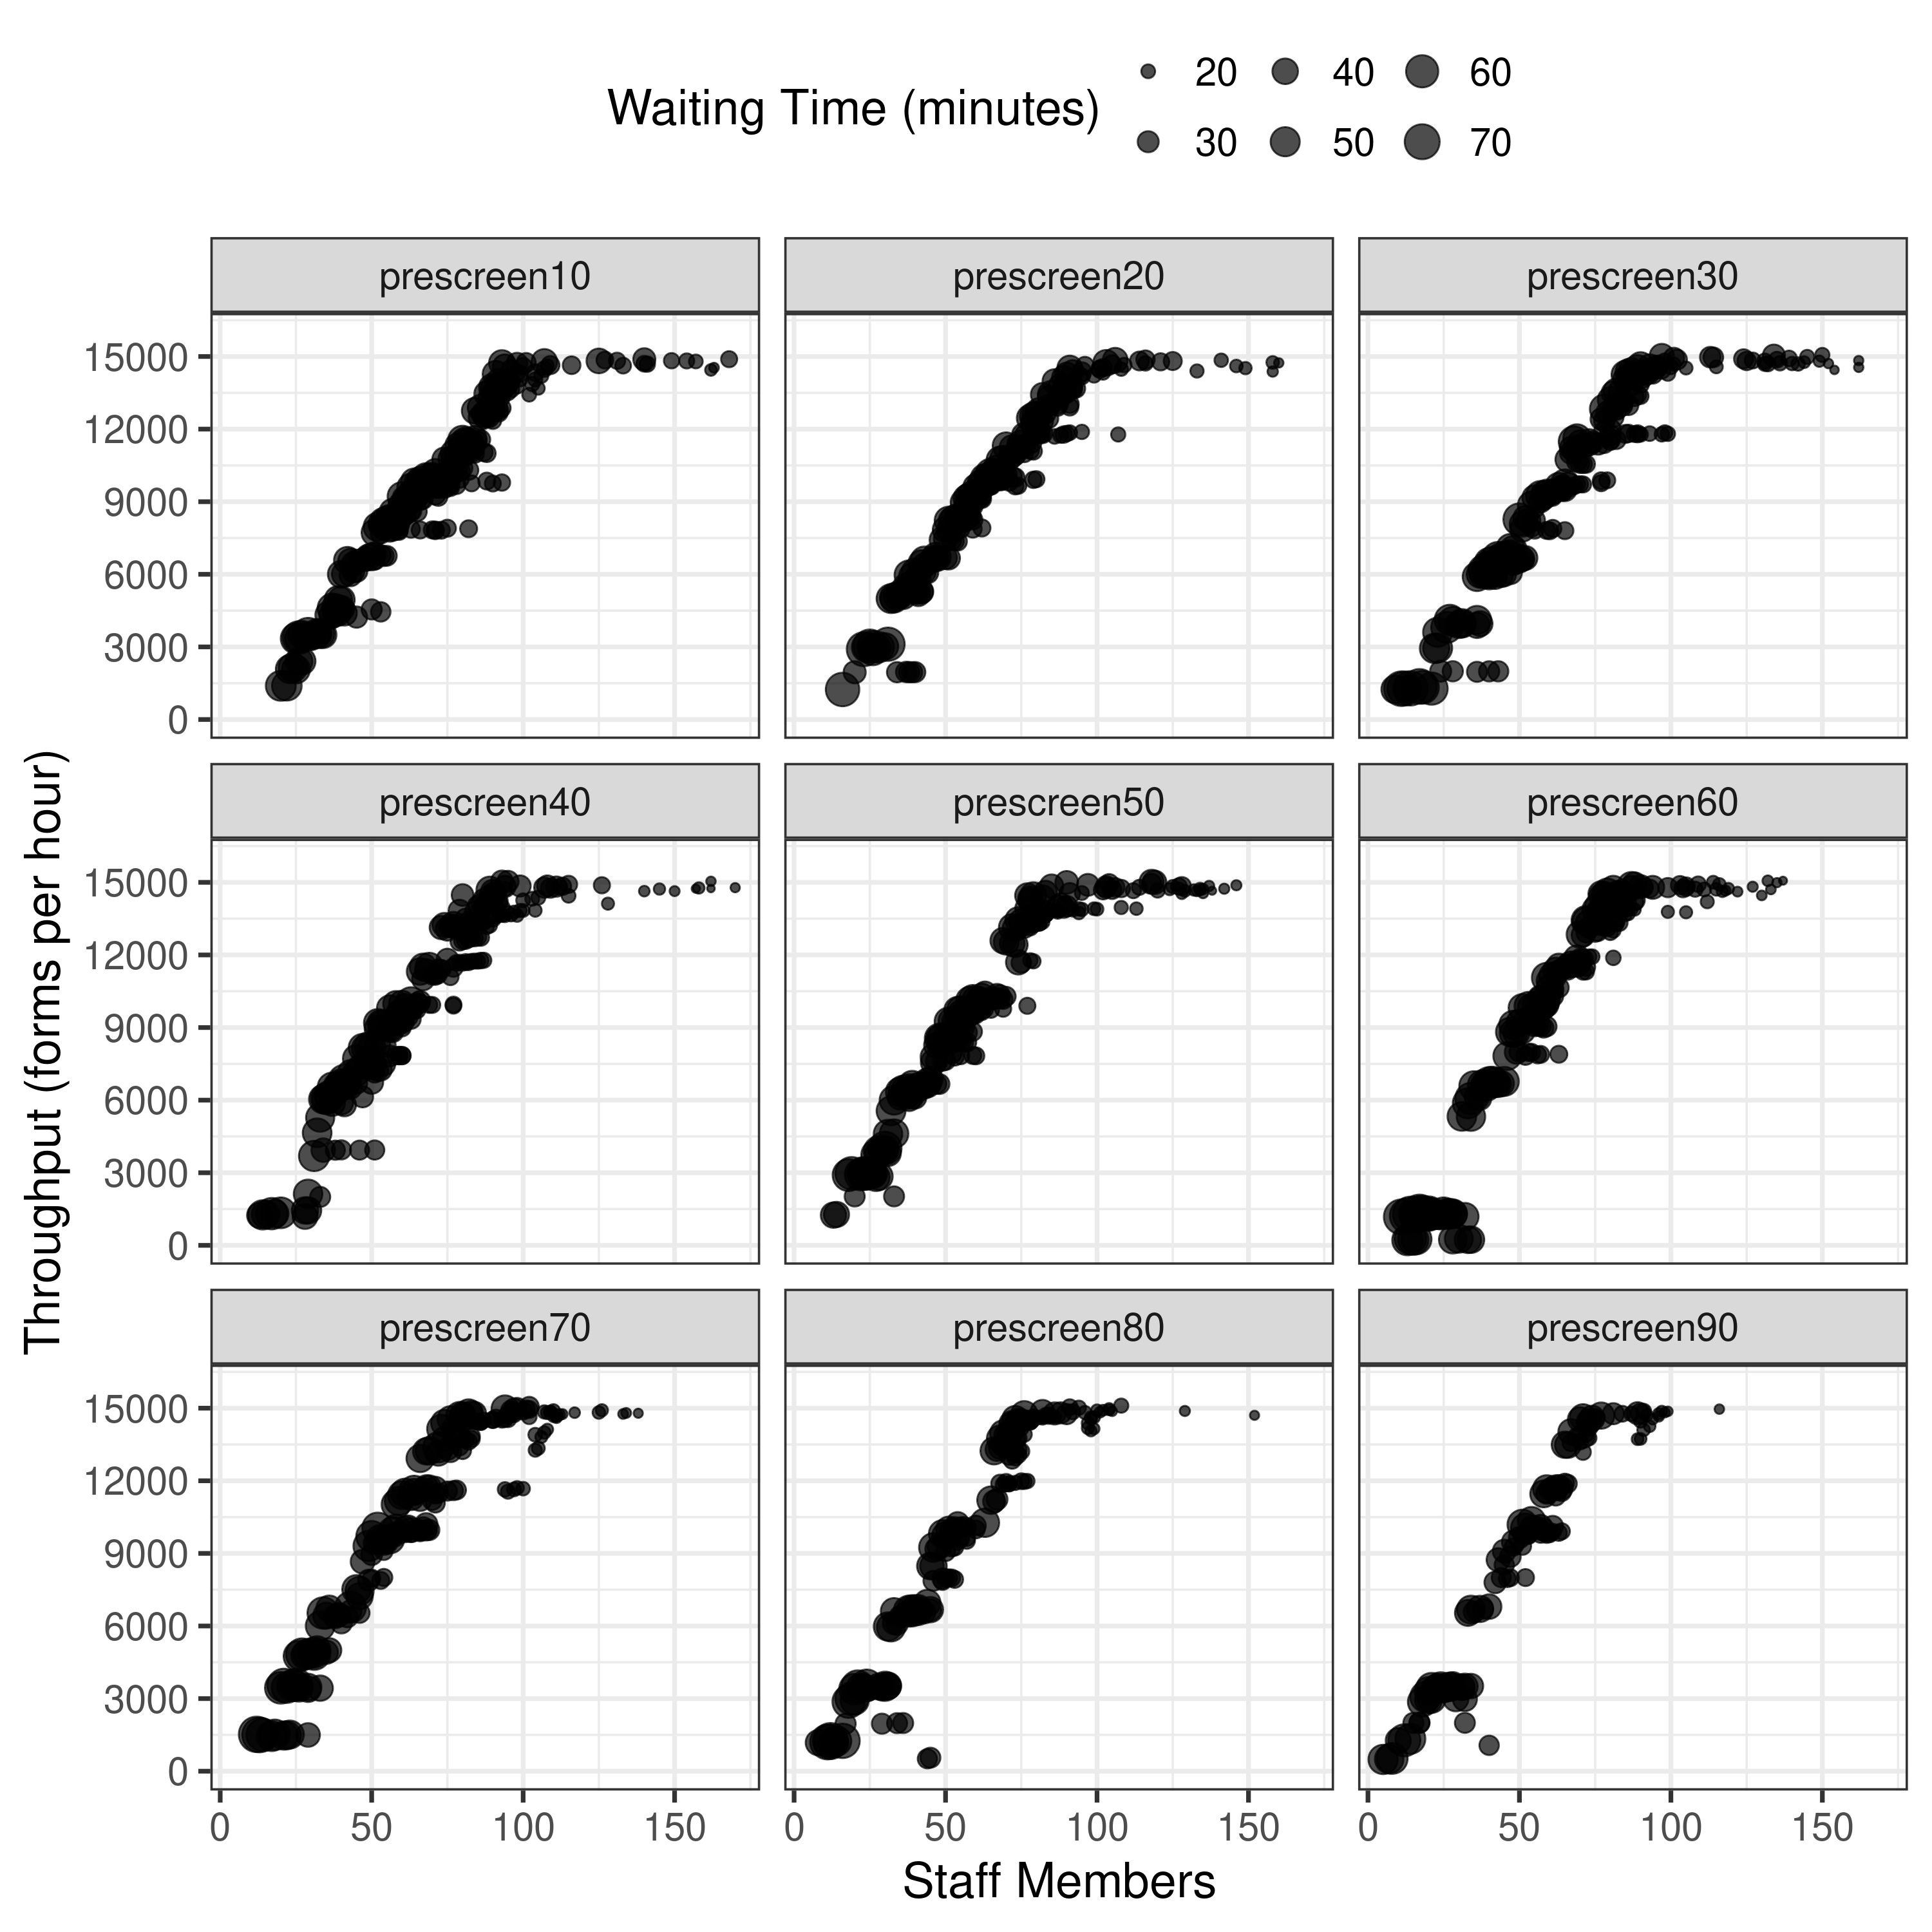
Cannot display original figure as do not have permission for reuse, but can view at Hernandez et al. (2015)
Reproduction:
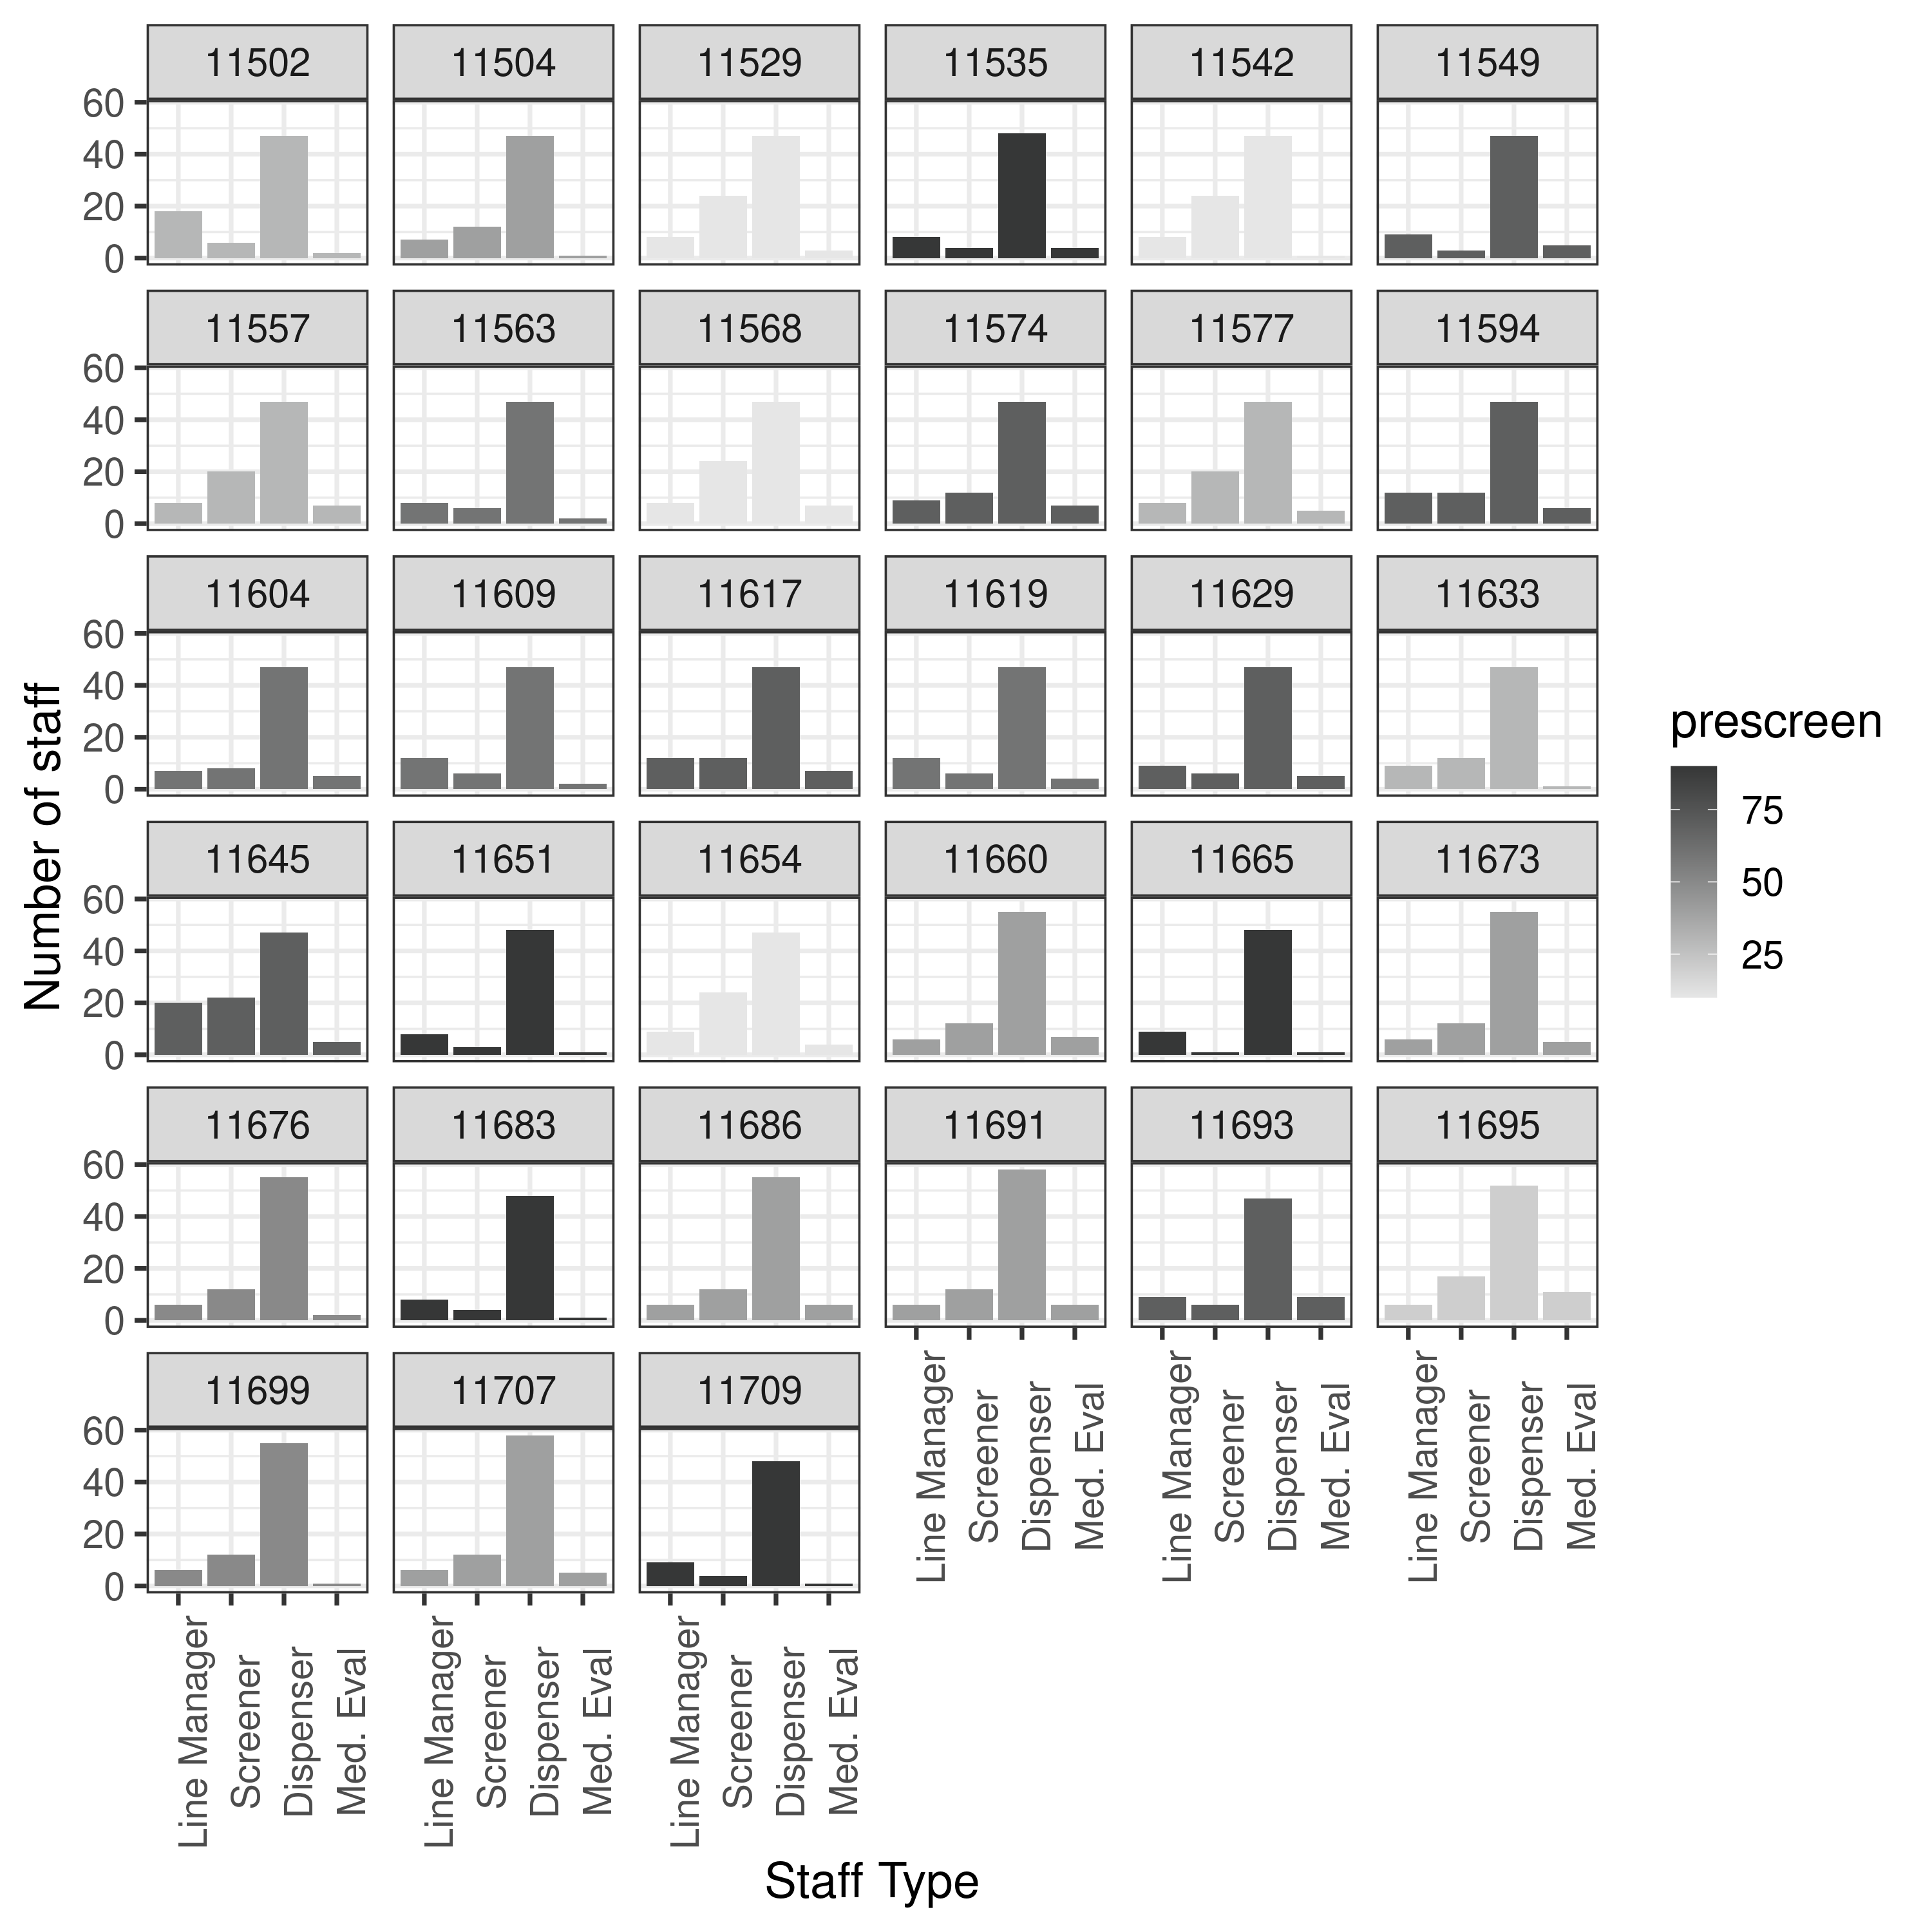
Cannot display original figure as do not have permission for reuse, but can view at Hernandez et al. (2015)
Reproduction:
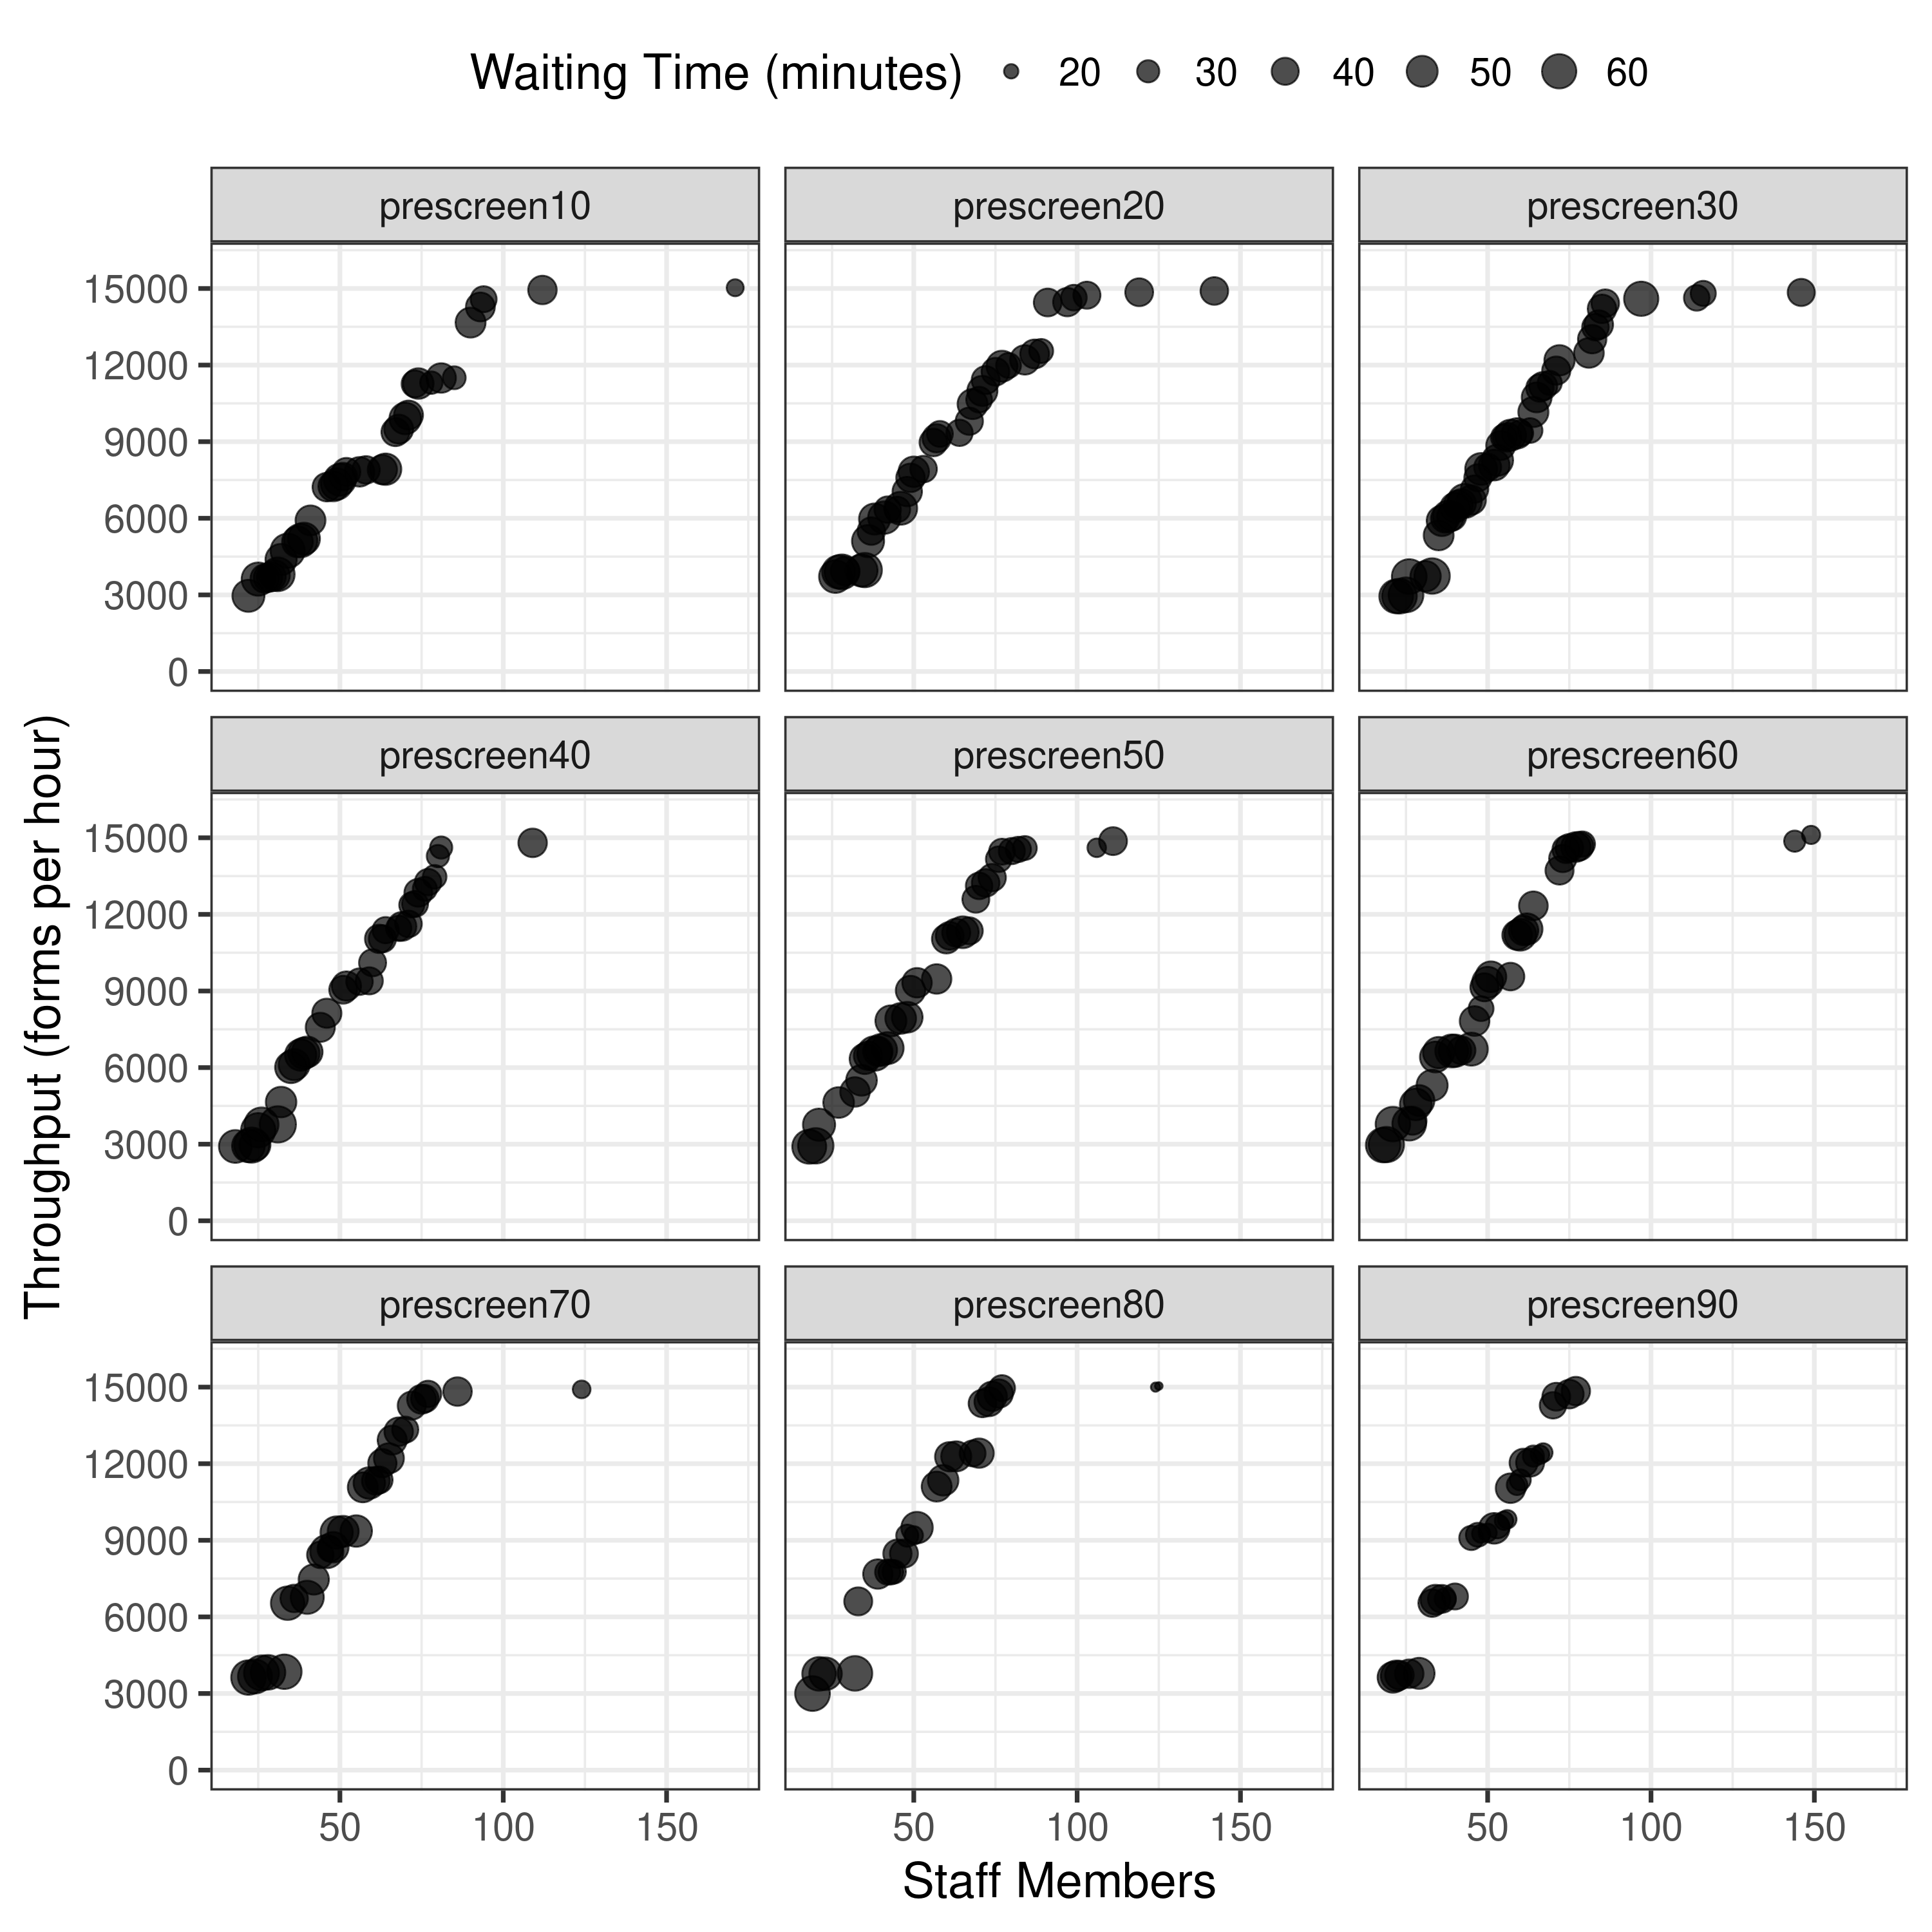
Cannot display original figure as do not have permission for reuse, but can view at Hernandez et al. (2015)
Reproduction:
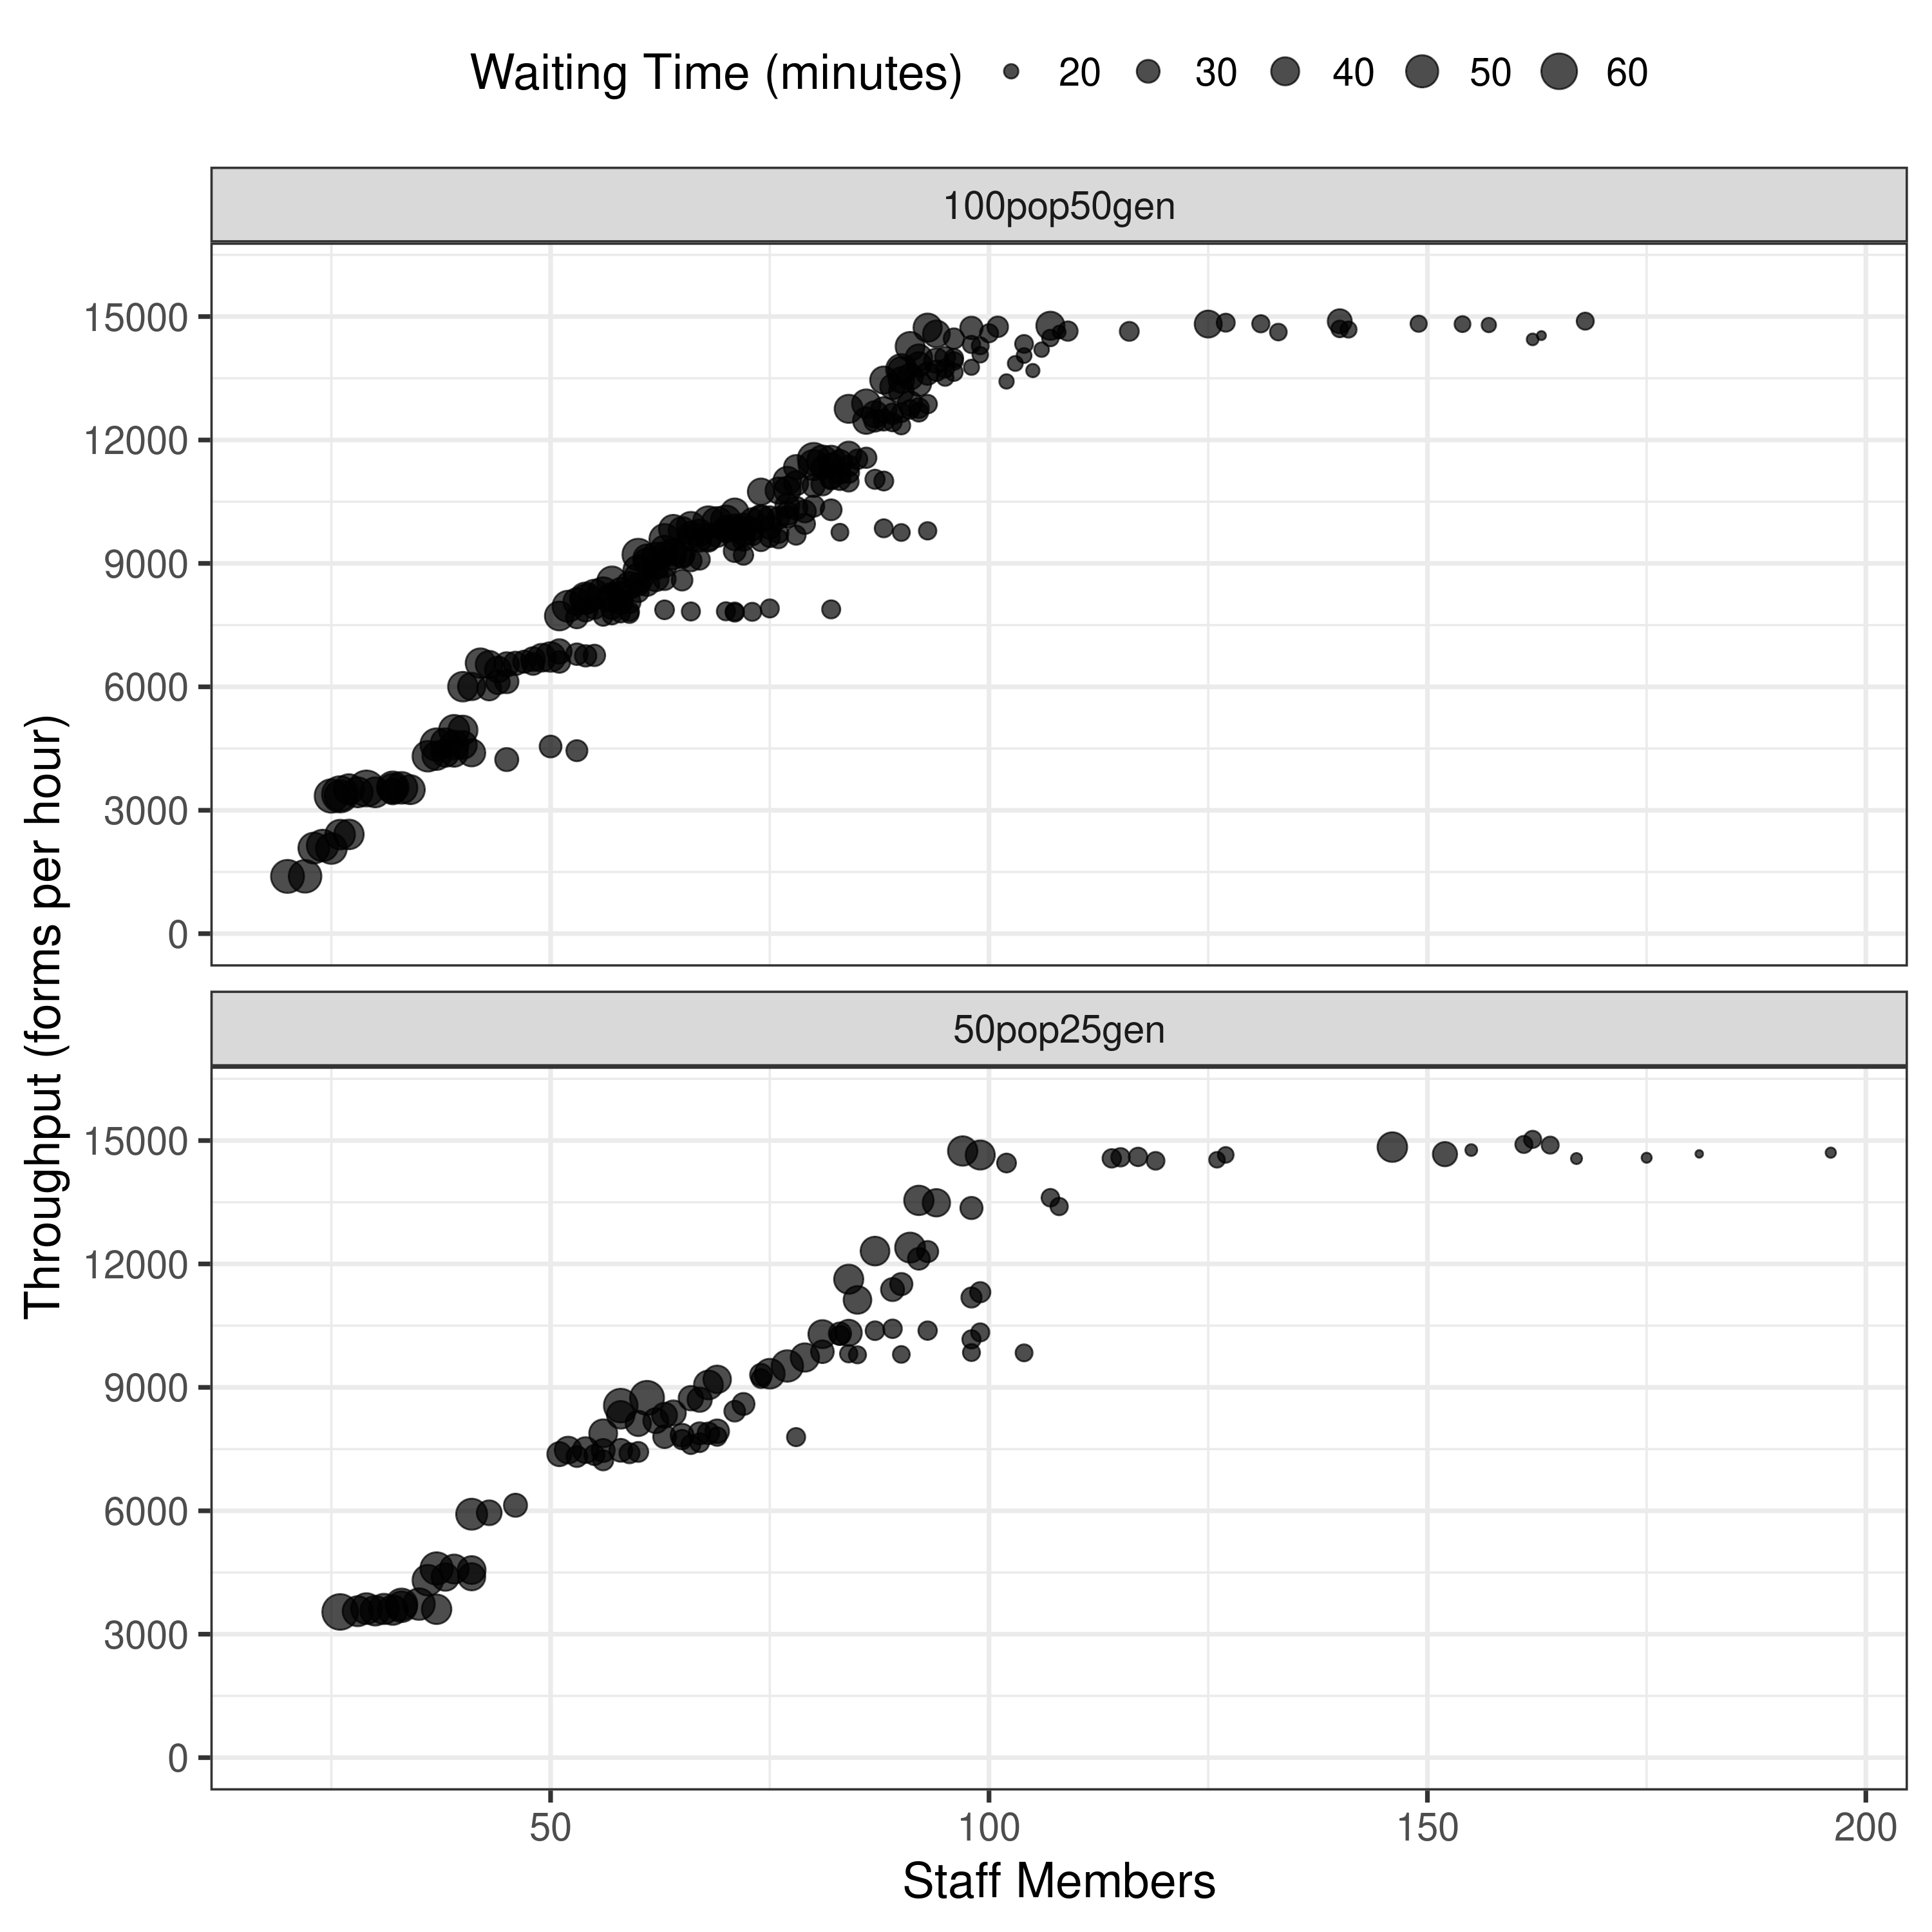
Cannot display original figure as do not have permission for reuse, but can view at Hernandez et al. (2015)
Reproduction:
Cannot display original figure as do not have permission for reuse, but can view at Hernandez et al. (2015)
Reproduction:
Cannot display original figure as do not have permission for reuse, but can view at Hernandez et al. (2015)
Reproduction:
Cannot display original table as do not have permission for reuse, but can view at Hernandez et al. (2015)
Reproduction:
Cannot display original table as do not have permission for reuse, but can view at Hernandez et al. (2015)
Reproduction:
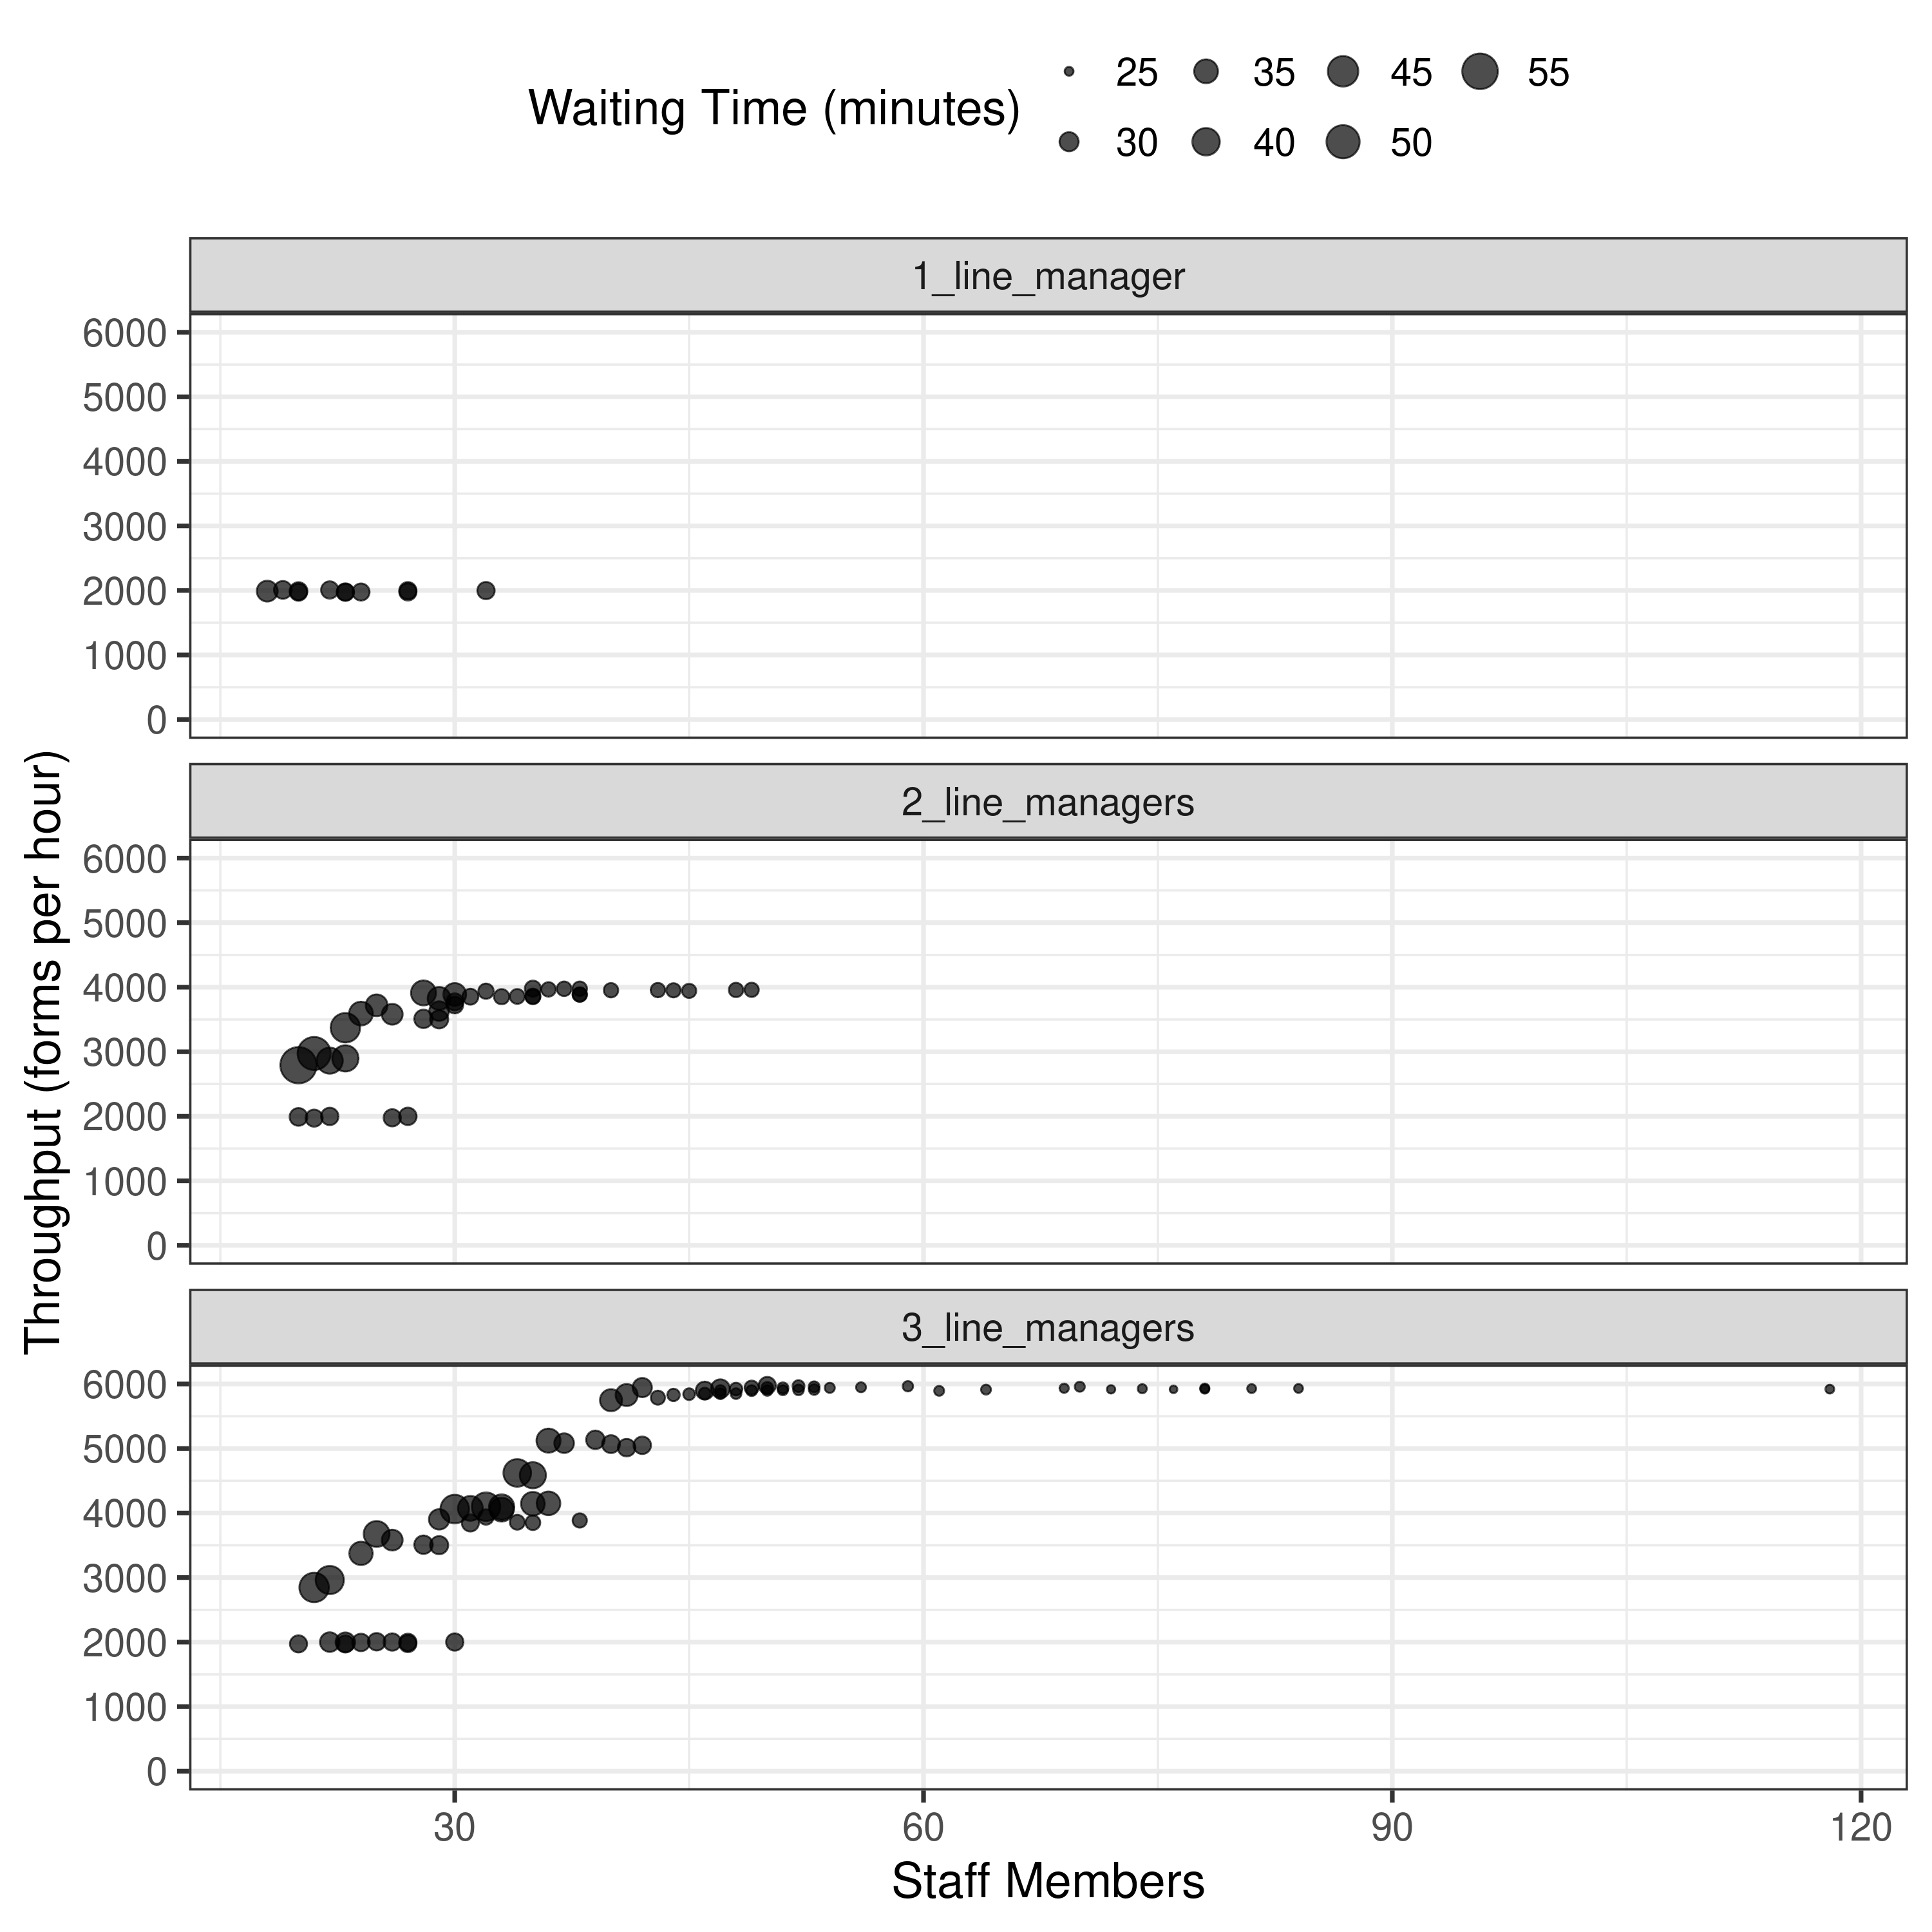
| Line Manager | Screening | Dispensing | Med. eval. | Total staff | Wait. time | Forms processed | |
|---|---|---|---|---|---|---|---|
| 0 | 4 | 1 | 14 | 1 | 20 | 52 | 1392 |
| 1 | 4 | 1 | 14 | 3 | 22 | 51 | 1394 |
| 2 | 7 | 1 | 14 | 1 | 23 | 47 | 2080 |
| 3 | 8 | 1 | 14 | 1 | 24 | 48 | 2143 |
| 4 | 7 | 1 | 14 | 3 | 25 | 47 | 2070 |
| 5 | 4 | 6 | 14 | 1 | 25 | 54 | 3347 |
| 6 | 9 | 1 | 14 | 2 | 26 | 44 | 2407 |
| 7 | 4 | 6 | 14 | 2 | 26 | 47 | 3355 |
| 8 | 5 | 6 | 14 | 1 | 26 | 62 | 3387 |
| 9 | 9 | 1 | 14 | 3 | 27 | 44 | 2412 |
| 10 | 4 | 6 | 14 | 3 | 27 | 45 | 3509 |
| 11 | 4 | 6 | 14 | 4 | 28 | 45 | 3436 |
| 12 | 8 | 6 | 14 | 1 | 29 | 61 | 3530 |
| 13 | 4 | 6 | 14 | 6 | 30 | 45 | 3435 |
| 14 | 16 | 1 | 14 | 1 | 32 | 35 | 3455 |
| 15 | 4 | 10 | 14 | 4 | 32 | 43 | 3531 |
| 16 | 8 | 6 | 14 | 4 | 32 | 49 | 3557 |
| 17 | 8 | 6 | 14 | 5 | 33 | 49 | 3545 |
| 18 | 4 | 10 | 14 | 6 | 34 | 42 | 3501 |
| 19 | 4 | 6 | 25 | 1 | 36 | 46 | 4313 |
| 20 | 4 | 6 | 25 | 2 | 37 | 41 | 4325 |
| 21 | 5 | 6 | 25 | 1 | 37 | 51 | 4597 |
| 22 | 4 | 6 | 25 | 3 | 38 | 39 | 4389 |
| 23 | 5 | 6 | 25 | 2 | 38 | 42 | 4637 |
| 24 | 4 | 6 | 25 | 4 | 39 | 38 | 4387 |
| 25 | 5 | 6 | 25 | 3 | 39 | 42 | 4585 |
| 26 | 7 | 6 | 25 | 1 | 39 | 45 | 4949 |
| 27 | 5 | 6 | 25 | 4 | 40 | 40 | 4586 |
| 28 | 7 | 6 | 25 | 2 | 40 | 43 | 4945 |
| 29 | 4 | 10 | 25 | 1 | 40 | 44 | 6003 |
| 30 | 4 | 6 | 25 | 6 | 41 | 38 | 4396 |
| 31 | 4 | 10 | 25 | 2 | 41 | 39 | 6009 |
| 32 | 4 | 10 | 27 | 1 | 42 | 43 | 6576 |
| 33 | 4 | 10 | 25 | 4 | 43 | 32 | 5958 |
| 34 | 4 | 10 | 27 | 2 | 43 | 38 | 6546 |
| 35 | 4 | 10 | 25 | 5 | 44 | 31 | 6109 |
| 36 | 4 | 10 | 27 | 3 | 44 | 36 | 6420 |
| 37 | 18 | 1 | 25 | 1 | 45 | 30 | 4231 |
| 38 | 4 | 10 | 25 | 6 | 45 | 31 | 6129 |
| 39 | 4 | 10 | 27 | 4 | 45 | 33 | 6545 |
Evaluation against guidelines
Context: The original study repository was evaluated against criteria from journal badges relating to how open and reproducible the model is and against guidance for sharing artefacts from the STARS framework. The original study article and supplementary materials (excluding code) were evaluated against reporting guidelines for DES models: STRESS-DES, and guidelines adapted from ISPOR-SDM.
References
Hernandez, Ivan, Jose E. Ramirez-Marquez, David Starr, Ryan McKay, Seth Guthartz, Matt Motherwell, and Jessica Barcellona. 2015. “Optimal Staffing Strategies for Points of Dispensing.” Computers & Industrial Engineering 83 (May): 172–83. https://doi.org/10.1016/j.cie.2015.02.015.